Profiling
The Zend Profiler displays a breakdown of the executed PHP code in order to detect bottlenecks in scripts by locating problematic sections of code. These are scripts that consume excessive loading-time. The Profiler provides you with detailed reports that are essential to optimizing the overall performance of your application.
See below for a list of the five different profiling methods Zend Studio includes.
PHP CLI Application
Allows you to profile files on your workspace using Zend Studio's
internal debugger.
The Internal Debugger enables developers to locally validate freshly developed
code before deploying to a web server. The internal option means that
only files located in local directories can be profiled. When profiling
internal files the Zend Studio Internal Debugger uses its own PHP executable
that was installed together with Zend Studio.
See Locally Profiling a PHP Script for more information.
PHP Script Remote Profiling
Allows you to profile files on your workspace using your server's Zend Debugger.
This allows you to profile local files using the Zend Debugger situated on your server. This allows you to test your files in the production environment, and allows you to utilize the extensions installed on your server.
See Remotely Profiling a PHP Script for more information.
Note:
Your server must be running the Zend
Debugger or Xdebug in order for remote debugging and
profiling capabilities to function.
The Zend Debugger comes bundled with
PHP Web Application
Allows you to profile applications situated on a server. It allows you to profile whole applications and projects.
The PHP Web Page Profile setting has an option to give the files you are working on first priority when profiling, using the ”Local Copy” option. This means that, when possible, file content is taken from the files situated on your Workspace. This prevents you from having to upload the latest revisions.
Note:
It's recommended that your local project structure reflect the project structure on your server.
See Profiling a PHP Web Page for more information.
Note:
Your server must be running the Zend
Debugger or Xdebug in order for remote debugging and
profiling capabilities to function.
The Zend Debugger comes bundled with
URL Profiling
Allows you to enter a URL to profile an application on a server. Only server files will be profiled, so the files do not need to exist locally in your Workspace.
See Profiling a URL for more information.
Once a Profile session has been executed (see Using the Profiler for more information on how to execute a profiling session), various views in the Profiling Perspective provide information on the performance of your script. See PHP Profile Perspective for more information on the various views.
Toolbar Profiling
Profile files and applications directly from your browser.
See Profiling Using the Zend Debugger Toolbar for more information.
Profiler Views
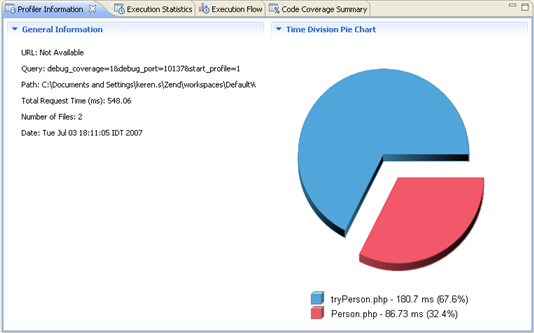
Profiler Information view
Provides general information on the profiling duration
and date, number of files constructing the requested URL and more. In
addition, it displays a Time Division Pie Chart for the files in the URL.
The right side displays time division in a pie chart and the left side
provides the following information:
-
URL - The URL analyzed (if applicable).
-
Query - The specific query parameters.
-
Path - The location of the first file called.
-
Total Request Time - Total processing time for the entire page.
-
Number of Files - Number of files processed.
-
Date - Date and time that the profiling took place.

Execution Statistics view
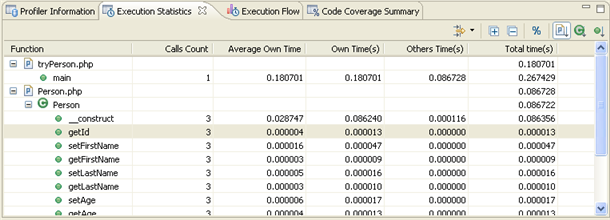
Displays the list of files that were called during the profiling process and detailed information on processing times for elements within the files. The window contains statistics relevant to each element as follows:
-
Function - The name and location of the function.
-
Calls Count - The number of times that the function was called.
-
Average Own Time - The average duration without internal calls.
-
Own Time(s) - The net process duration without internal calls.
-
Others Time(s) - Time spent on calling other files.
-
Total Time(s) - The total time taken to process.

Note:
Click the 'Show as percentage' button on the toolbar to see the statistics as percentages rather than times.
Right- clicking a function in the list gives you the option to 'Open Function Invocation statistics'. This will open a view with statistics about the selected function, the functions it was invoked by and functions that it invoked.
Execution Flow view
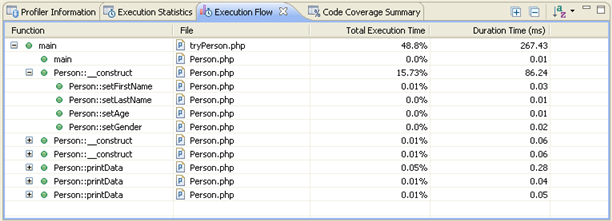
Shows the flow of the execution process and summarizes percentages and times spent on each function.
-
Function - Function name.
-
File - The file in which the function is located.
-
Total Execution Time - Percent of time taken per function.
-
Duration Time - Time taken per function in milliseconds.

Right-clicking a function in the list gives you the option to:
-
View Function Call - Will open the selected function call in the editor.
-
View Function Declaration - Will open the selected function declaration in the editor.
-
Open Function Invocation statistics - Will open a view with statistics about the selected function, the functions it was invoked by and functions it invoked.
Code Coverage Summary
Summary of how many lines of code were covered during the Profiling process.
-
Element - The file / project that was called.
-
Covered Lines (Visited / Significant / Total) - Percentage of lines covered within each file. (Visited = Number of lines covered / Significant = number of lines that were significant to the function call / Total = Total number of lines in the file.)

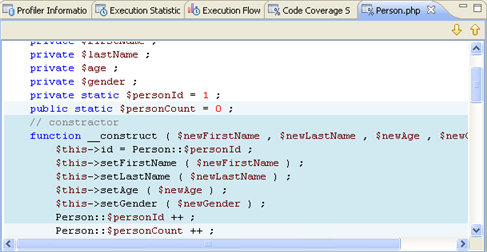
Clicking on the 'Covered lines' percentages will open an editor containing the file, with the covered lines highlighted:


