Configuring Xdebug

This topics describes how to configure Zend Studio for debugging with the Xdebug extension.

Configuring Xdebug for CLI Debugging

This topic describes how to configure Zend Studio to use Xdebug to debug your files as a CLI application.

Prerequisites


Instructions on how to complete a procedure

To configure CLI debugging with Xdebug:

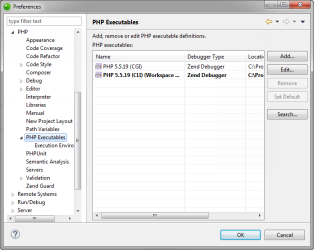
  1. In the menu-bar, go to Window | Preferences | PHP | PHP Executables.
    The PHP Executables dialog is displayed.

  1. Click Add.
    The Add New PHP Executable dialog is displayed.

  1. Enter the following information:
    • Name - Name of the PHP executable (e.g., PHP 5.5.7 with Xdebug).
    • Executable path - File path to the PHP executable.
    • PHP ini file (Optional) - File path to the 'php.ini' file.
  2. Click the SAPI Type drop-down menu, and select a SAPI type (CLI, CGI).
  3. Click the PHP debugger drop-down menu, and select Xdebug.
  4. Click Finish.
    Zend Studio adds the new PHP executable to the PHP Executables list.
  5. Click Set as Default to make Xdebug the default PHP executable, and click OK.
  6. In the menu-bar, go to Window | Preferences | PHP | Debug.
    The Debug Preferences dialog is displayed.

  1. In the CLI Settings area, select the PHP executable with Xdebug from the PHP Executables drop-down menu.
  2. Click Apply, and OK.
    Xdebug is set as the default PHP debugger.
    You can now debug your files and application as CLI using Xdebug. For more information on debugging, see Debugging PHP in Zend Studio.

Project specific settings can be configured from Project | Properties | PHP Debug.

Configuring Xdebug for Web Application Debugging

Prerequisites


Instructions on how to complete a procedure

To configure Web application debugging with Xdebug:

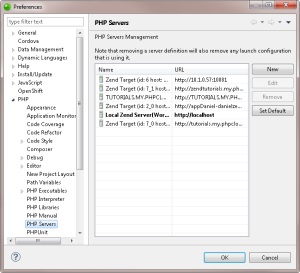
  1. In the menu-bar, go to Window | Preferences | PHP | PHP Servers.

  1. Select the server from the Servers list, and click Edit.
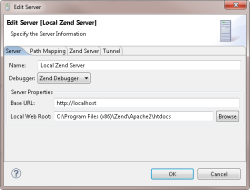
    The Edit Server dialog is displayed.

  1. Click the Debugger drop-down menu, and select Xdebug.
  2. Click OK.
  3. Back in the PHP Servers dialog, click OK
    Xdebug is set as the default PHP debugger for debugging on your server.
    You can now debug your files and application as a Web application using Xdebug. For more information on debugging, see Debugging PHP in Zend Studio..

Project specific settings can be configured from Project | Properties | PHP Debug.