Remotely Debugging a PHP Script
This procedure describes how to debug files in your workspace remotely using your server's Zend Debugger. Use this function if you want to test the execution of the file in 'real time' on the production server. This is especially relevant if your server has loaded extensions.
Note:
Your server must be running the Zend
Debugger or Xdebug in order for remote debugging and
profiling capabilities to function.
The Zend Debugger comes bundled with
|
|
|
|
|
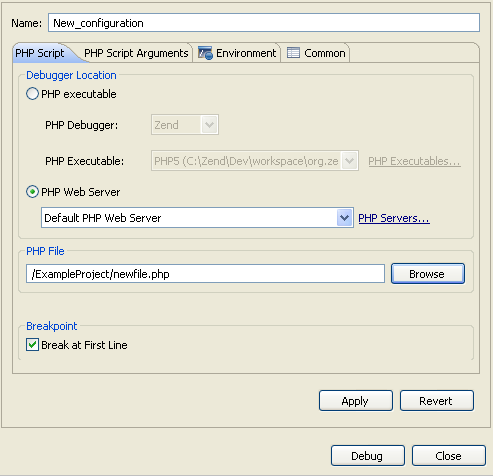
To remotely debug a PHP Script:
New Debug Configuration
|
|
A number of views will open with relevant debug information. See the "Running and Analyzing Debugger results" topic for more information on the outcome of a debugging process. |
|
Note:
If the remote debugging session is unsuccessful, check that your server's root directory contains a Dummy File. This file should match the name of the Dummy File as defined in the Advanced Options section of the PHP Debug preferences page (accessible from Window | Preferences | PHP | Debug). By default, the file will be called "dummy.php".
Note:
If the file contains 'include' or 'require' calls to
files which are not contained within the project, you must add
them to the project's Include Path in order to simulate your production
environment.
In addition, if a file defined with an absolute path to a server location
(See 'Include Paths' for more on absolute
file locations) is called, a Path Mapping dialog will appear. See Path
Mapping for more information.


