Working with Application Monitoring

Application Monitoring provides a tight integration between Zend Studio and Zend Server by utilizing data collected by your server during application development and providing live notifications in Zend Studio for each Zend Server event, thus enabling you to develop and monitor your application within the same development environment.

Enabling/Disabling Application Monitoring

This procedure describes how to manually enable or disable monitoring for a server.


Instructions on how to complete a procedure

To enable/disable Application Monitoring:

  1. From the Menu-bar, select Window | Show View | PHP Servers to display the PHP Servers view.
  2. In the PHP Servers view, right-click the server you wish to enable/disable Application Monitoring for, and select Start/Stop Server Monitoring.


Adding Filters for Application Monitoring

This procedure describes how to manually enable or disable monitoring for requests made to a specific application by adding a URL filter.

Tip:

Monitoring is automatically enabled for applications deployed or launched with the Enable Development Mode option selected . See Deploying an Application for more information.


Instructions on how to complete a procedure

To add filters for Application Monitoring:

  1. From the Menu-bar, select Window | Show View | PHP Servers to display the PHP Servers view.
  2. In the PHP Servers view, double-click the server you wish to enable/disable Application Monitoring for.
    The Edit Server dialog is displayed.
  3. Select the Monitoring tab.

  1. Click Add.
    The Add Filter dialog is displayed.

  1. Enter the exact URL of the application you wish to monitor, and click OK.
    The URL is added to the filters area.
  2. Click Apply to save settings, and OK.
    Application Monitoring is enabled for the application URL you defined.


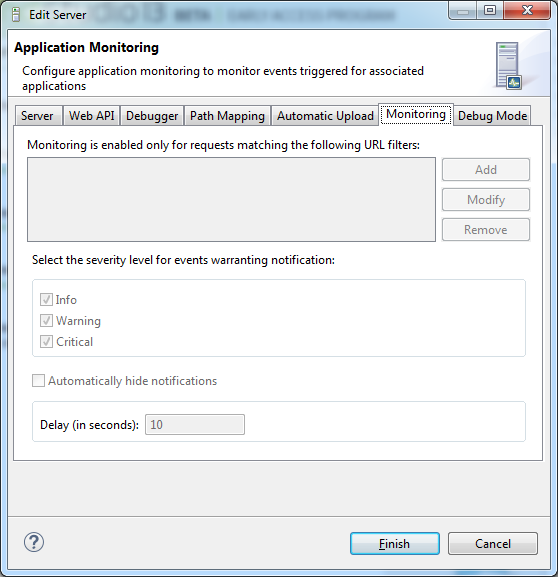
Configuring Application Monitoring

You can fine tune the Application Monitoring feature to best suit your working environment.


Instructions on how to complete a procedure

To configure Application Monitoring:

  1. From the Menu-bar, select Window | Show View | PHP Servers to display the PHP Servers view.
  2. In the PHP Servers view, double-click the server you wish to enable/disable Application Monitoring for.
    The Edit Server dialog is displayed.
  3. Select the Server Monitoring tab.

  1. In the Filters area, add , modify or delete, URL filters by clicking Add, Modify, Remove. For more information, see Adding Filters for Application Monitoring above.
  2. Select the event severity level to filter incoming notifications:
  • Info- Events expressing normal and expected Zend Server behavior. Example: Application Updated Successfully.
  • Warning- Events expressing abnormal or unexpected Zend Server behavior. Example: Function Error.
  • Critical- Events expressing critical Zend Server behavior. Example: Fatal PHP Error.
  1. To make Zend Studio automatically hide notifications after a set period of time:
    1. Select the Automatically hide notifications check- box.
    2. In the Delay field, enter a time limit (in seconds).
  2. Click Apply.


Analyzing Events with Application Monitoring

Application Monitoring will notify you of any server Event, according to the severity level you selected.

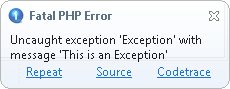
Subsequently, the following actions can be performed:

  • Repeat- Reproduces the same request
  • Source- Opens and displays the relevant file and code that triggered the Event

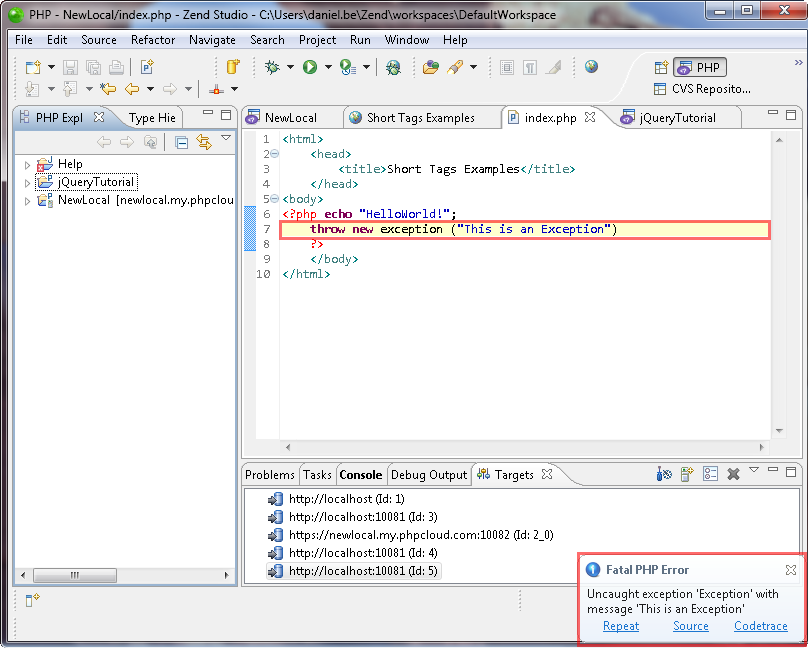
  • Codetrace- Opens codetracing for the Event in Zend Server