Profiling Monitor View
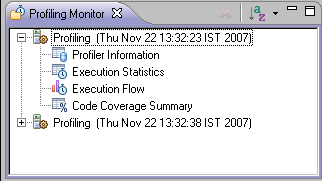
The Profiling Monitor view displays a list of previously run Profiling sessions.
Expanding the list under a Profiling session allows you to select a Profiling view to display.
Toolbar Commands
|
Icon |
Name |
Description |
|
|
Delete Session |
Deletes a Profiling session from the list. This will be enabled if a profiling session is selected. |
|
|
Sort Profile Sessions |
Click the arrow next to the Profile Session to sort the Profile Session list by date or time. |
Note:
The Profiling Monitor view is displayed by default as part of the Profiling Perspective. To manually open the view, go to Window | Show View | Other | PHP Profiler | Profiling Monitor.

Copyright © 2017 Rogue Wave Software


