Debuggers Preferences

The Debuggers preferences page allows you to configure your debugger's global settings, and can be accessed from Window | Preferences | PHP | Debug | Debuggers.

Note:

The debugger settings configured in the Debuggers preferences dialog can be overridden at the server and PHP executable level.

Installed Debuggers

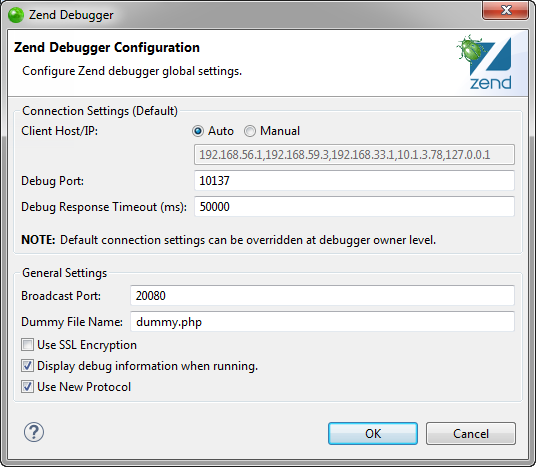
Configuring Zend Debugger Settings

Note:

The debugger settings configured in the Debuggers preferences dialog can be overridden at the server and PHP executable level.


Instructions on how to complete a procedure

To configure your Zend Debugger settings:

  1. Select the Zend Debugger.

  2. Click Configure.
    The Zend Debugger Configuration dialog is displayed.

  1. Configure the following debugger settings:

  • Connection Settings:

    • Client Host/IP - Select to manually enter a list of Client Host/IPs to which debugging results will be returned or allow Zend Studio to automatically search for and recognize the Client Host/IPs. Entering a specific Host/IP will speed up the debugging process and decrease the likelihood of session timeouts.
    • Debug Port - The port which the Zend Debugger will use. The default port is 10137.

    • Debug Response Timeout (ms) - Default 50000
  • General Settings:
    • Broadcast Port - The Broadcast Port allows your Zend Browser Toolbar or your Zend Server to detect your debugging preferences. The Broadcast Port number entered here must match the Broadcast Port entered in your Zend Browser Toolbar. The default port is 20080.
    • Dummy File Name - This is the file which the PHP Script debugger uses in order to start a PHP script debugging session on a specified server. The name should be left as the default dummy.php. However, if this is changed, ensure the change has also been made on your server.
      See Ensuring the Placement of dummy.php for more information.
    • Use SSL Encryption - Mark this checkbox to Encrypt Communication using SSL. Your server must support this option in order for it to be applicable.
    • Use New Protocol - This check-box is selected by default, and applies Zend Studio 10.x performance improvements to the Zend Debugger. If you have encountered any issues with the Zend Debugger, de-select this check-box to revert to previous Zend Debugger protocol.
  • Run with Debug info - Mark the check-box for Debug info, such as the Console view and the Browser Output, to be displayed when a Run configuration is executed.

Note:

If the field contains too many host/IPs, the session could timeout before a debugging connection is established. Entering a non-existent host/IP could cause the session to terminate.

  1. Click OK to return to the Debuggers preferences page.

  2. Click Apply to apply your settings.


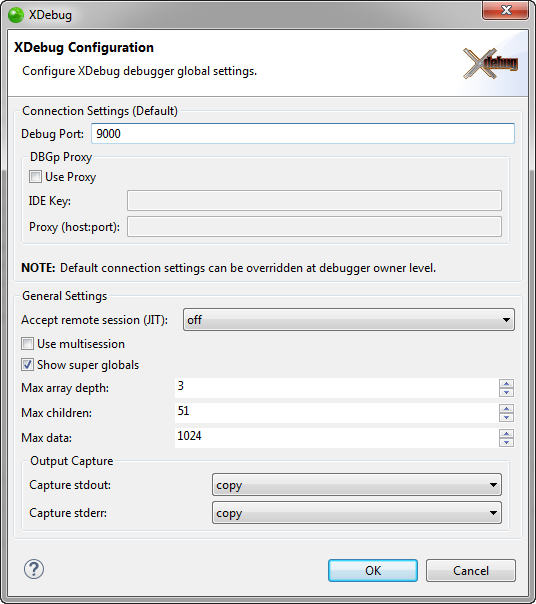
Configuring XDebug Settings

Note:

The debugger settings configured in the Debuggers preferences dialog can be overridden at the server and PHP executable level.


Instructions on how to complete a procedure

To configure XDebug settings:

  1. Select XDebug.

  2. Click Configure.
    The XDebug Configuration dialog is displayed.

  1. Configure XDebug settings:
    • Connection Settings:
      • Debug port - The port Zend Studio listens on (default: 9000). Corresponds to the value specified for "xdebug.remote_port" in PHP.INI.
      • DBGp Proxy Closed allows multiple developers to debug a single or multiple applications on the same web server - select the check-box to enable support for a proxy.
        • IDE Key -
        • Proxy (host/port) - the address of the configured proxy. For example if the proxy is configured on your machine listening for IDE connections on port 9001, then enter '127.0.0.1:9001'.

        Note:

        If you are running the proxy on your machine, you must ensure that the Zend Studio XDebug port is not the same as that of the proxy ports. The proxy uses 2 ports, one for listening for debug connections from PHP and XDebug (default 9000), and the other is for IDE connections (default 9001).

    • General Settings: 
      • Accept Remote Sessions (JIT) - click the drop-down menu and select one of the following options:
        • Off - any remote session request is rejected

        • Localhost - only remote sessions initiated from the localhost are accepted

        • Any - any remote session from any machine is accepted

        • Prompt - prompt the user that a remote session initiation has been requested and for the user to accept or reject it

      • Use multisessionClosed allows multiple debug sessions to run under a single application launch thus allowing a developer to debug multiple sessions at the same time - select to simultaneously debug multiple sessions
      • Show superglobals - displasy the super globals in the Variables view when debugging
      • Max array depth - defines how much data is retrieved on a single request for nested arrays. This does not restrict the depth that can be displayed, just how much information is retrieved per request to XDebug.
      • Max children - defines the maximum number of array children or object properties that will be initially retrieved. This doesn’t restrict showing all the entries, just the number of entries retrieved per request.
      • Output Capture - for stdout and stderr, select one of the following options:
        • Off - no information is captured, nothing will be displayed in the views (output from a PHP script, a non web page script, will still be displayed in the console).
        • Copy - information will be captured and displayed in the views.
        • Redirect - information will be captured and displayed in the views. Redirect should stop output from the PHP script being displayed in the console as well.
  2. Click OK to return to the Debuggers preferences page.
  3. Click Apply to apply your settings.