Execution Statistics View
The Execution Statistics view displays the list of files that were called during the profiling process and detailed information on processing times for elements within the files.
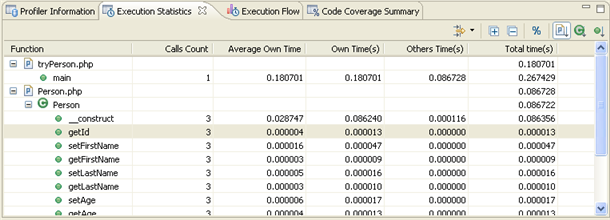
The window contains statistics relevant to each element as follows:
-
Function - The name and location of the function.
-
Calls Count - The number of times that the function was called.
-
Average Own Time - The average duration without internal calls.
-
Own Time(s) - The net process duration without internal calls.
-
Others Time(s) - Time spent on calling other files.
-
Total Time(s) - The total time taken to process.
Note:
Click the 'Show as percentage' button on the toolbar to see the statistics as percentages rather than times.
Right- clicking a function in the list gives you the option to 'Open Function Invocation statistics'. This will open a view with statistics about the selected function, the functions it was invoked by and functions that it invoked.
Toolbar Commands
|
Icon |
Name |
Description |
|
|
Filters... |
Click the arrow next to the icon to select to display only the results with:
Click the icon itself or select Manage Filters from the list to launch the Edit filter dialog which allows you to create or edit your own filter conditions. |
|
|
Expand/Collapse all |
Expands/collapses the list. |
|
|
'Show as Percentage' |
Toggles the view to show your times in seconds or percentages. |
|
|
Group by File |
Sorts the list by file. |
|
|
Group by Class |
Sorts the list by class. |
|
|
Group by Function |
Sorts the list by function. |
Note:
The Execution Statistics view is displayed by default as part of the Profiling Perspective. To manually open the view, go to Window | Show View | Other | PHP Profiler | Execution Statistics.

Copyright © 2017 Rogue Wave Software


