Debugging / Profiling Events from Zend Server

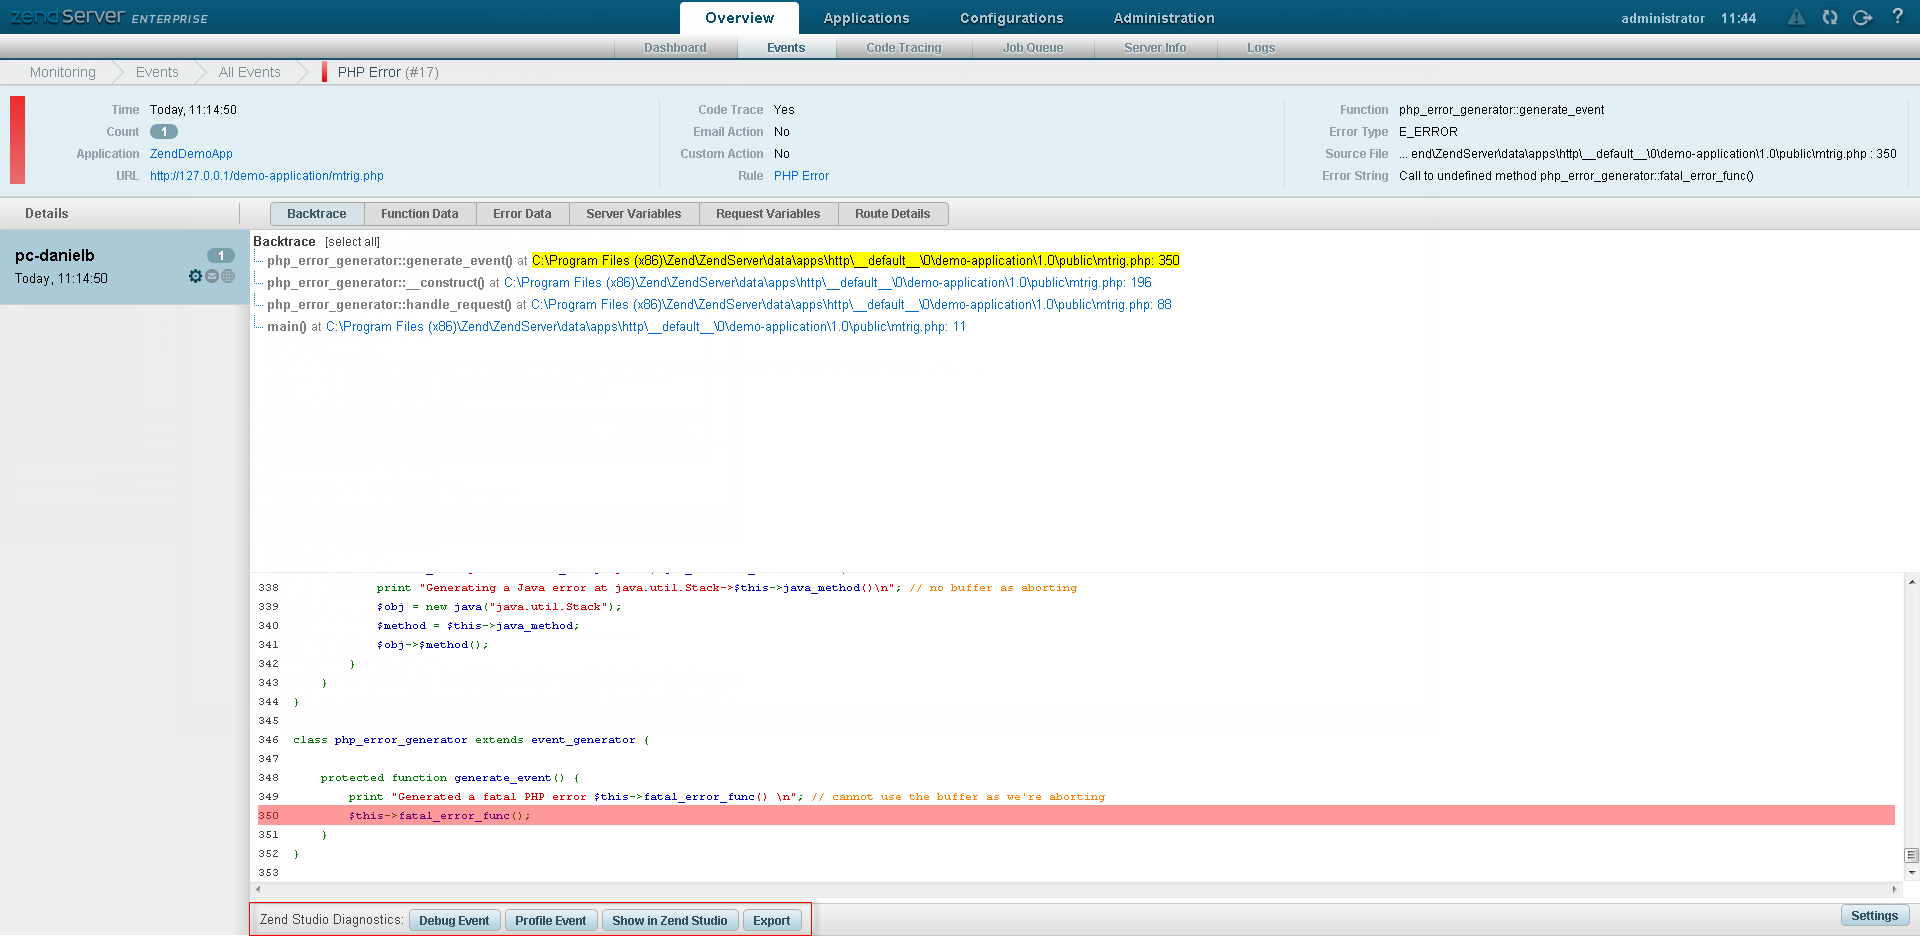
Zend Studio allows integration with Zend Server so that Zend Server events can be viewed, debugged and profiled in order to detect and locate errors and issues causing slow script execution.

Note

Before debugging Zend Server events, ensure the integration between Zend Studio and Zend Server is correctly configured as described in Setting Up Zend Server Integration.


Instructions on how to complete a procedure

To debug an event directly from Zend Server :

  1. Open your Zend Server events list.

  1. Access the Events List by browsing to the Overview | Events page.

  2. Select the event ID which you want to debug.
    The Event Details page is displayed.

  1. To select the server on which the debug/profile session will be run, in the Zend Studio Diagnostics area click Settings .
    This gives you access to the following options:

  • Originating server - This will debug the event on the server from which the event originated

  • Alternate server - Allows you to debug the event on a different server (this server must also be running the Zend Debugger). Enter the IP address of the required server.

  1. Click the Set button to save your settings.

  2. Click the Debug Event or Profile Event button.

  3. The relevant debug / profile session is launched in Zend Studio.

Note:

If Zend Server cannot connect to Zend Studio , see both the see the Setting Up Zend Server Integration topic and the 'Error: Failed to Communicate with Zend Studio' topic in the Zend Server Online Help.

See Running and Analyzing Debugger Results for more information on running a debug session or the PHP Profile Perspective topic for more on the information displayed once a Profile session has been run.