Remotely Profiling a PHP Script
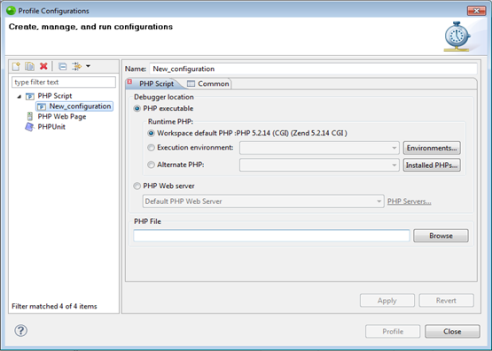
This procedure describes how to profile a PHP Script from your workspace using the Zend Debugger installed on your remote server.
Note:
Your server must be running the Zend
Debugger or Xdebug in order for remote debugging and
profiling capabilities to function.
The Zend Debugger comes bundled with
|
|
|
|
|
To remotely profile a PHP script:
|
|
The Profiling Perspective will open, displaying the Profiling Monitor window with various Profiling views. See the PHP Profile Perspective for more on the information that will be displayed once a profile session has been run. |
|
Note:
If the file contains 'include' or 'require' calls to files which are not contained within the project, you must add them to the project's Include Path in order to simulate your production environment.


