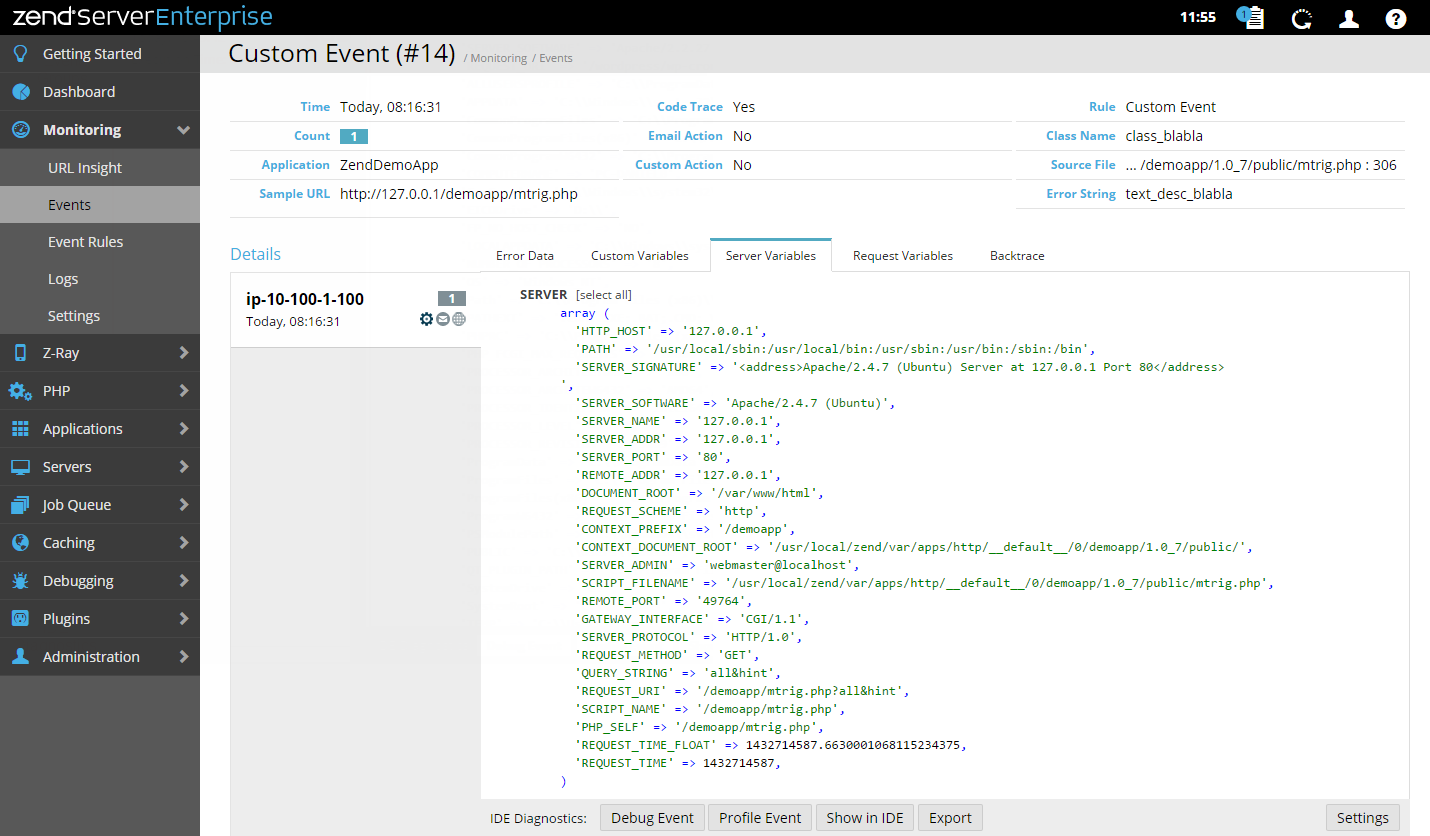
Event Details
The Event Details page is accessed from the Events page or the Dashboard page by selecting an event ID from the Events list , or by clicking More Details in an event's expanded view. The page contains all the available monitored event-related information and details, and Zend Studio diagnostic tools.
The Summary area displays general event details:
- Time - The time the event was generated.
- Severity - The severity of the event (Notice, Warning or Critical). See Event Severity Levels..
- Count - The accumulated amount of times the event was triggered between the first time the event occurred and the last time the event occurred.
- Applications - The name of the application associated with the event.
- URL - The URL of the application associated with the event.
- Code Trace - Executed and saved code trace (Yes, No).
- Email Action - Sent email (Yes, No).
- Custom Action - Executed customized action (Yes, No).
- Rule - Link to the monitoring rule triggering the event.
- Class Name - Displays information on the event class.
- Function - Displays information on the function that triggered the error, including the function name and arguments.
- Error Type - The type of the PHP error associated with the event.
- Source File - The source location of the associated application.
- Error String - The string of the PHP error associated with the event.
The Details table contains all related and available event details, and includes three components:
- Groups List - Displays aggregated event groups and related information:
- Server name - Name of originating server.
- Time stamp - When the event was generated.
- Execution Time - The request execution time.
- Memory Usage - The amount of memory used.
- Number of occurrences - How many events occurred within the event group.
- Triggered actions
 - Actions that were triggered by the event: Code Trace, Send Email, Custom Action.
- Event Details tabs - Selects type of event details to display:
- Error Data - Displays the PHP error and the Java backtrace if there was a Java exception.
- Custom Variables - Displays information for a custom event (i.e., class and user-defined information that was passed to the event when it was triggered).
- Server Variables - Displays the superglobals SERVER and ENV when there is relevant information.
- Request Variables - Displays information about the request. The superglobals (POST, GET and COOKIE) are always displayed. The other parameters (RAWPOST and FILE) are displayed only when there is relevant information to display.
- Route Details - Displays the code route (controller, action) leading to the event (e.g., MonitorRules | index).
- Backtrace - Displays all the function calls that were made before the event was triggered, including the relevant files for each function.
- Function Data - Displays information on the function that triggered the error, including the function name and arguments.
- Session - Displays the superglobal SESSION when there is relevant information.
- Job Queue - Job Queue related events display the reason the Job generated an event.
- Code Tracing - Code Tracing related Events display the reason that Code Tracing generated an event.
- Event Details display area - Displays information according to selected Event Detail tab.
This area contains action items for diagnosing events using an IDE:
|
Name |
Icon |
Description |
|
Debug Event |
|
Initiates a debug session for the event URL in your IDE. |
|
Profile Event |
|
Profiles the event URL in your IDE with the same parameters (GET, POST, COOKIE, HTTP headers, etc.). |
|
Show in Zend Studio |
|
Opens the file where the event occurred in the IDE. This option makes it possible to use your IDE to edit files and implement changes for multiple servers. |
|
Export |
|
Generates an XML file containing the selected event's information and exports it to your IDE. |


