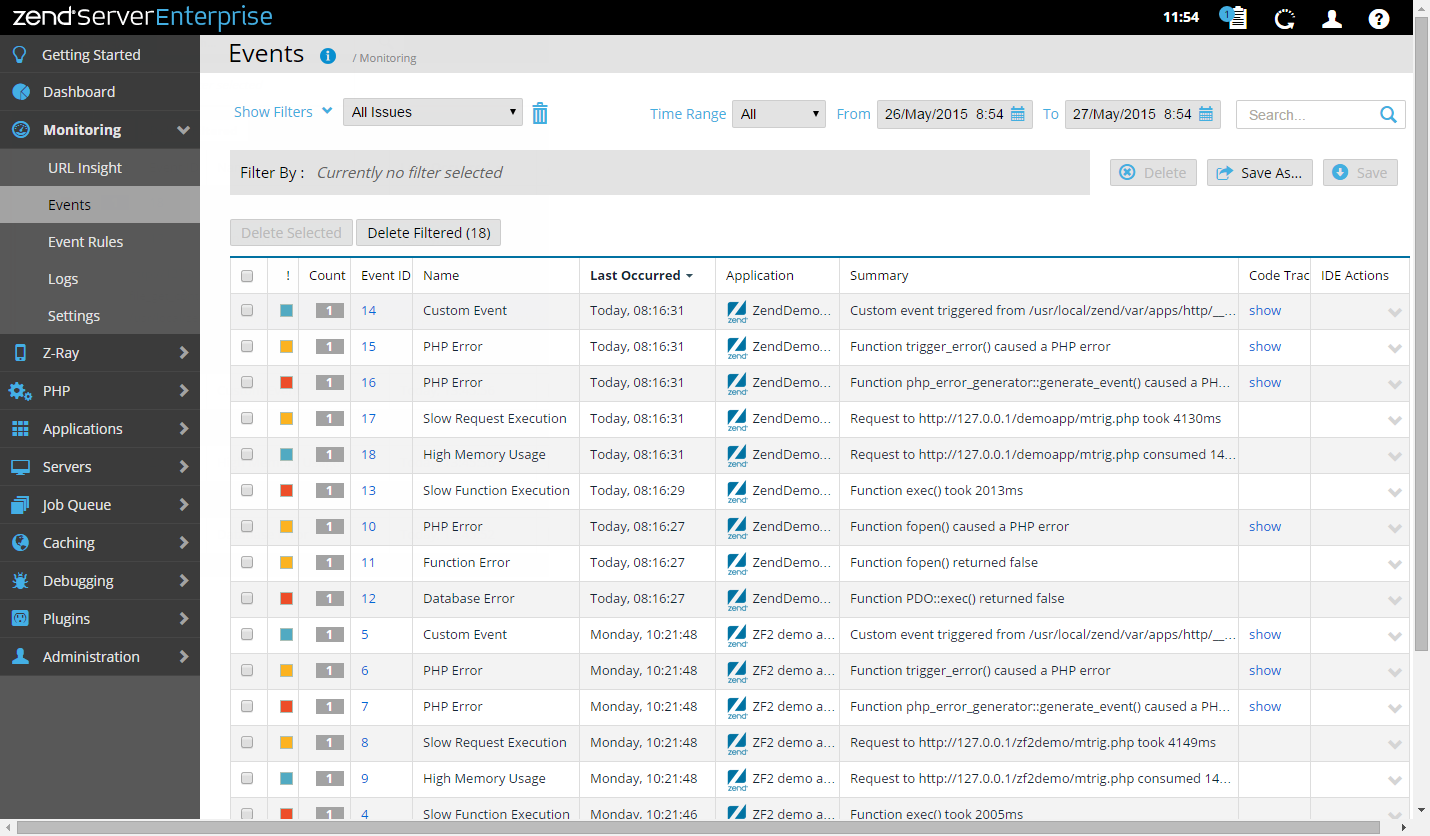
Events
The Events page is accessed from Monitoring | Events and is the main display for events.
An event is a collection of runtime-related information collected by the Zend Server Monitor component. This information is collected when an event is triggered, according to the conditions defined by the Monitoring Rules.
The Filters area is used to select and create filters for displayed events in the Events list:
- To open the filter list, click on the Advanced filter button, or choose a preset filter in the Stored filters menu.
Name
Description
Stored filters
Click to display list of pre-set and custom defined filters - selecting one opens the advanced filters panel
Time Range
Select from preset time ranges for the Jobs list, or use Custom and set your own range by providing start and end timestamps
Search Filter the jobs list records by specific search string Save As
Saves a filter after customization as a new filter or by existing name to override itself with new customization
Delete
Deletes a filter.
Reset
Reset all customization and revert to a fresh filter (All Events)
Advanced filters
This expands the filters area with customized Filter list - see below.
- Filter list - Displays all available categories and filters:
- JobQueue Related - Filters events by related Job Queue.
Severity - Filters events by severity (e.g., Warning).
Event Type - Filters events by type of event ( e.g., Custom Event Rule).
Rule Names - Filters events by rule name.
- Application - Filters events by the application they are associated with.
The Action bar is located below the Filters area, and is used to delete issues from the Events list:
|
Name |
Button |
Description |
|
Delete Selected |
|
Deletes selected issues from the Event list. |
|
Delete Filtered |
|
Deletes all issues that match the selected filter from the Event list, even those that are not displayed. |
Events are displayed in an list. The information for each listed event is sorted into columns:
- ! - The severity
of the event (Notice, Warning or Critical). See Event Severity Levels.
- Count - The number of events triggered for the same issue.
- Event ID - ID number for the event. Click to view full event details.
- Name - The type category of the event.
- Last occurred- The time and date of the event's last occurrence.
- Application - The name of the application associated with the event.
- Summary - A short event description of what occurred and where.
- Route Details - The code route (controller, action) leading to the event (e.g., MonitorRules | index).
- Code Trace- Link to existing code trace (Code Tracing | Traces).
Action Menu
The Action drop-down menu is located on the right-side of each event line, and contains all event-related action items. The menu appears as you hover over an event line, or if you select an event from the list, and contains the following action items:
- Debug in Zend Studio - Initiates a debug session for the event URL in Zend Studio.
- Profile in Zend Studio - Profiles the event URL, using the Zend Studio Profiler with the same parameters (GET, POST, COOKIE, HTTP headers, etc.).
- Show in Zend Studio - Opens the file where the event occurred in Zend Studio. This option makes it possible to use Zend Studio to edit files and implement changes for multiple servers.
- Export to Zend Studio - Generates an XML file containing the selected event's information and exports it to Zend Studio.
Selecting an event from the Events list, or clicking the Expand View arrow  on the right side of the event line, displays an expanded view of the event.
The Expanded view includes the following information:
- URL - The URL of the associated application.
- Execution Time - The request execution time.
- Memory Usage - The amount of memory used.
- Function Name - Displays information on the function that triggered the error, including the function name and arguments.
- Error Type - The type of PHP or JAVA error that was triggered (e.g., E_WARNING)
- Source File - The source location of the associated application.
- Error String - System error definition.
- Event groups and count- The last three event groups and the amount of events for each group.
- Date and time - A time stamp of when the event last occurred.
- More Details-> - Click to view full event details.


