Open topic with navigation
Importing Zend Server Event Data
Importing Zend Server
Event Data allows you to view and analyze trace data (execution data)
from your server. The execution data includes function call trees, arguments
and return values, function execution duration, memory usage and indication
for an executed files name and line of code. This enables you to capture
problems when they occur, which eliminates the need to set up environments
and reproduce the steps that led up to the failure.
Zend Studio allows
you to import a .amf, .xml or .zsf file:
-
A .amf file is a trace data file which can be opened without
access to Zend Server.
The trace file opens in the Code
Tracing editor where you can locate errors directly in the
trace data and then Open the Source
of Trace Data. You may then edit the source inside of the corresponding
local file.
-
A .xml file is an event configuration file which allows you
to recreate and debug an error when you have access to a Zend Server on which the application
exists.
-
A .zsf
file is a unified event file which may contain .amf files and/or a
.xml files. To import a .zsf file, follow the procedure Importing
Zend Server Event Data if you would like to use an included .amf
file to view and analyze trace data, or follow the procedure Importing
a Zend Server Event File to use an included .xml file to recreate
the error using the event details.
Note:
In order to import Zend Server
Event Data, you must first export Zend Server
Event Data from your server. For more information see Exporting Trace Information in the Zend Server Online Documentation.
Having an active connection with a licensed version of Zend Server or
Zend Server Cluster Manager allows you to fully integrate the Code
Tracing feature. For more information see Zend
Server.
Importing Zend
Server Event Data (amf)
This procedure describes how to import an amf trace data file into Zend Studio. Trace data in an
amf format can be imported and used to Open
the Source of Trace Data even when there is no active connection with
a Zend Server which
contains the application.
|
|
|
|

|
To import a .amf Zend Server Event File:
-
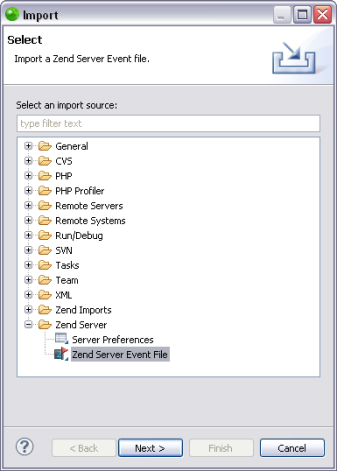
To open the Import Wizard go to File
| Import | Zend Server
| Zend Server
Event File.

-
Click Next.
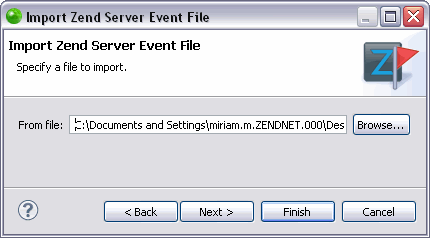
The "Import Zend Server
Event File" dialog opens.

Note:
If you have downloaded a .zsf file containing
both a .amf file and .xml file, a message will appear after clicking
Next in the Import
Zend Server Event File dialog asking you which action you would
like to take. To use the .amf file to view and analyze trace data,
click Trace.
-
In the "From File" text field, browse
to the location of your Zend Server
Event File and click Next.
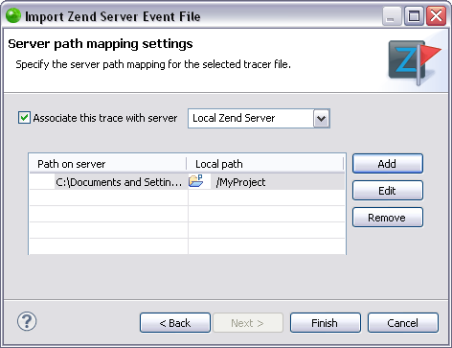
The "Server path mapping setting" dialog opens.

-
Select the server to associate with from the
"Associate this trace with server" drop down menu.
-
You can add, edit or remove a path map from
this page using the appropriate buttons. You may select to
have a path in your workspace or in the file system. For more
information see Adding
a New Path Map for Importing a Zend Server Event File.
-
Click Finish
to save the changes.
-
Click Yes
when the "Confirm Perspective Switch" message appears
asking your permission to open the Zend Server
Code Tracer perspective.
The Code
Tracing Editor opens with the imported Zend Server Event File
open in the Tracer View.
|
|
For
information about the functionalities available in the Zend Server Code Tracer perspective
see Working with Code
Tracing.
|
Importing a
Zend Server Event File
(xml)
This procedure describes how to import an xml event file into Zend Studio. You can import
an xml format Zend Server
Event File to recreate and debug an error. The Zend Studio
functionality for an imported xml Zend Server
Event File is only available when you have access to a Zend Server on which the application
exists.
|
|
|
|

|
To import a .xml Zend Server Event File:
-
To open the Import Wizard go to File
| Import | Zend Server
| Zend Server
Event File.

-
Click Next.
The "Import Zend Server
Event File" dialog opens.

Note:
If you have downloaded a .zsf file containing
both a .amf file and .xml file, a message will appear after clicking
Next in the Import
Zend Server Event File dialog asking you which action you would
like to take. To use the .xml file to recreate the error using
the event details, click Event.
-
In the "From file" text field, browse
to the location of your Zend Server
Event File and click Next.
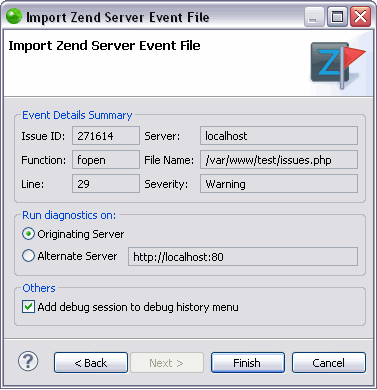
The Import Zend Server Event File dialog opens.

-
The dialog contains the following information:
-
Event Details Summary
-
Issue ID - A unique number assigned to each event
in Zend Server.
This number is displayed next to each event in the Events page.
-
Server - The name or host of the originating server.
-
Function - Displays information on the function
that triggered the error.
-
File Name - The original location where the event
occurred.
-
Line - The line in the file (which is specified
in the File Name field) that created the event.
-
Severity - The severity of the event (Warning or
Critical). The severity is defined in the event's master
settings in the Monitor tab. For more information see
Monitor in the Zend
Server Online Documentation.
-
Run Diagnostics on
-
Originating Server - Choose this option to run the
diagnostics on the originating server. You must have a
working connection with the originating server if you
choose this option.
-
Alternate Server - Choose this option to run the
diagnostics on an alternate server, and enter the details
of your server.
Note:
In order to run the diagnostics on an alternate
server, the alternate server must also contain the application
that generated the events.
-
Click Finish
to save the changes.
The PHP Debug Perspective
opens and the debug session begins.
|
|
For
information about how to evaluate the debugging results see Running and Analyzing Debugger
Results.
|

©1999-2012 Zend Technologies LTD. All rights reserved.

![]()
