Variables View [PHP Debug Perspective]
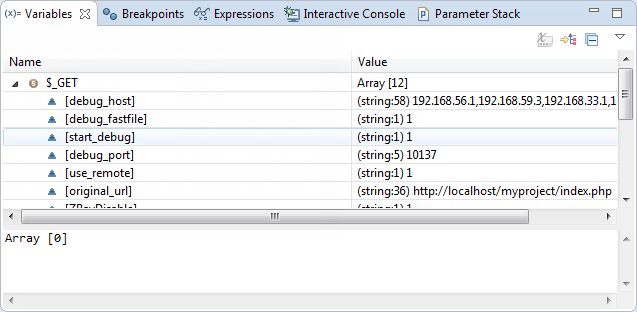
The Variables view displays information about the variables associated with the stack frame selected in the Debug View.
Selecting a variable will display details in the detail pane below the view. Expanding the list under a variable will display its fields. Icons are displayed besides the variable and its fields reflecting their nature (e.g. local vs. global). Changes are marked by highlighting the variable.

Note:
Right-click a variable and select Watch or Create Watch Expression to add the variable to the Expressions view.
Toolbar Commands
|
Icon |
Name |
Description |
|
|
Show Type Names |
If selected, type names will be displayed. |
|
|
Show Logical Structure |
Shows the logical structure. |
|
|
Collapse All |
Collapses the list. |
Menu Commands
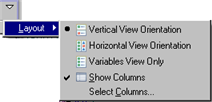
The view's menu can be accessed through the view menu icon ![]() .
.

|
Name |
Description |
|
Layout |
Defines the view's layout:
|
Note:
The Variables View is displayed by default as part of the Debug Perspective. To manually open the view, go to Window | Show View | Other | Debug | Variables.
Variable Icons
|
Icon |
Description |
|
|
Array member |
|
|
Local variable |
|
|
Private field |
|
|
Protected field |
|
|
Superglobal variable |
|
|
Public field/ $this object |
|
|
Class (virtual element for grouping variables while in a class static context) |
|
|
Array partition (virtual element for grouping large sets of array members. For Zend Debugger it is added if size of an array exceeds 100, for XDebug it is defined by 'Max children' property in the XDebug configuration) |
|
|
Indicates static field. Applies to private, protected and public field (displayed in right-top corner of corresponding icon) |


