Profiling a URL
This procedure describes how to profile a URL.
Note:
Your server must be running the Zend
Debugger or Xdebug in order for remote debugging and
profiling capabilities to function.
The Zend Debugger comes bundled with
|
|
|
|
|
To Profile a URL:
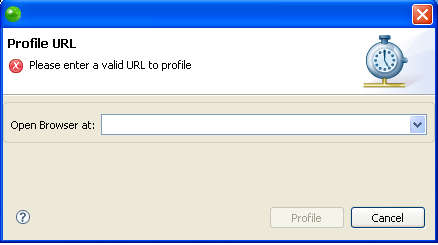
Profile URL dialog
|
|
The Profile Perspective will open with a number of views detailing information about the profiling process. See the PHP Profile Perspective for more on the information that will be displayed once a profile session has been run. |
|


