Importing Zend Server Events into Zend Studio

Zend Server events can be exported from Zend Server into a .zsf file which allows you to recreate an error when you do not have access to the Zend Server on which the event occurred. The event can then be imported into Zend Studio and debugged.

For information about importing Code Tracing information, see Working with Code Tracing.

Exporting a Zend Server Event File

This procedure describes how to export a Zend Server Event file (.zsf) from the Zend Server UI.

Note:

Zend Server events can only be exported through the Zend Server GUI.


Instructions on how to complete a procedure

To export an event from Zend Server :

  1. Open your Zend Server UI.

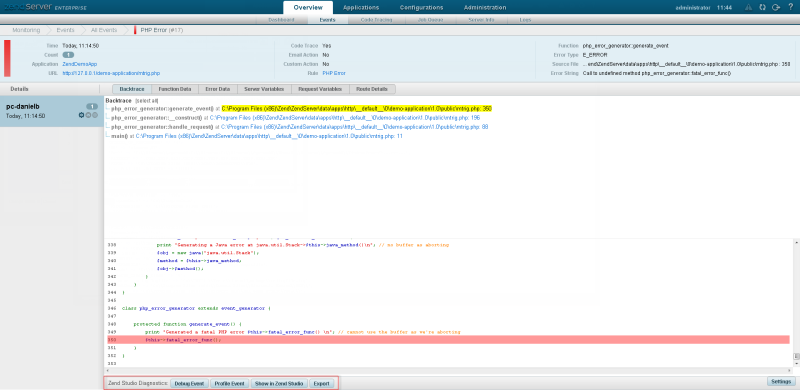
  2. Access the Events List by browsing to the Overview | Events page.

    Click the event which you want to export.

  1. In the Zend Diagnostics area at the bottom of the page, click the Export button.
  2. Select to save the file to a location on your file system.
  3. The exported file will be created as a .zsf file containing the event details.

Once a Zend Server event file has been exported it can be imported and debugged in Zend Studio.

Importing a Zend Server Event File

This procedure explains how to import a Zend Server Event file (.zsf) into Zend Studio for debugging.


Instructions on how to complete a procedure

To import and debug a Zend Server event in Zend Studio :

  1. From the menu bar, go to File | Import | Zend Server | Zend Server Event File and click Next.
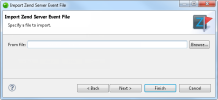
    The "Import Zend Server Event File" dialog is displayed.

  1. Click Browse, and browse to the location of the event file.
  2. Click Next.
    A dialog will open  with the details of the event.

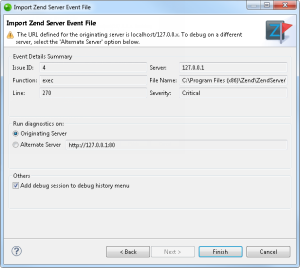
  1. The dialog contains the following information:

  • Event Details Summary

    • Issue ID - A unique number assigned to each event in Zend Server. This number is displayed next to each event in the Events page.

    • Server - The name or host of the originating server.

    • Function - Displays information on the function that triggered the error.

    • File Name - The original location where the event occurred.

    • Line - The line in the file (which is specified in the File Name field) that created the event.

    • Severity - The severity of the event (Warning or Critical). The severity is defined in the event's master settings in the Monitor tab. For more information see Monitor in the Zend Server Online Documentation.

  • Run Diagnostics on

    • Originating Server - Choose this option to run the diagnostics on the originating server. You must have a working connection with the originating server if you choose this option.

    • Alternate Server - Choose this option to run the diagnostics on an alternate server, and enter the details of your server.

Note:

In order to run the diagnostics on an alternate server, the alternate server must also contain the application that generated the events.

  1. By default, the event will be debugged on the server according to the server address defined in the event file.
    To debug on a different server, select the Alternate Server option and enter the address for the alternate server.
    Ensure the server on which you are running the debug session is configured to run remote debugging sessions. See Setting Up Remote Debugging for more information.

Note:

By default, a server defined on a local machine will have the server URL "localhost/127.0.0.x". If the address configured for the server from which the file was exported is configured as localhost, selecting the Originating Server option will run the debug session on the localhost server of the machine on which Zend Studio is located, which could be different than the server from which the event was exported. In this case, to debug the event on the originating server select the Alternate Server option and enter the URL of the originating server,

  1. Mark the 'Add debug session to debug history menu' checkbox for the debug session to be available from the debug menu.
  2. Click Finish.
    The debug session will launch. See Running and Analyzing Debugger Results for more information on running a debug session.