|

|
To import and debug a Zend Server event in Zend Studio :
- From the menu bar, go to
File | Import | Zend Server
| Zend Server Event File and click Next.
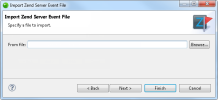
The "Import Zend Server Event File" dialog is displayed.
- Click Browse,
and browse to the location of the event file.
- Click Next.
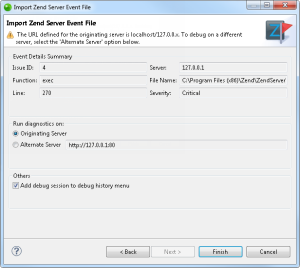
A dialog will open with the details of the event.
-
The dialog contains the following information:
-
Event Details Summary
-
Issue ID - A unique number assigned to each event
in Zend Server.
This number is displayed next to each event in the Events page.
-
Server - The name or host of the originating server.
-
Function - Displays information on the function
that triggered the error.
-
File Name - The original location where the event
occurred.
-
Line - The line in the file (which is specified
in the File Name field) that created the event.
-
Severity - The severity of the event (Warning or
Critical). The severity is defined in the event's master
settings in the Monitor tab. For more information see
Monitor in the Zend
Server Online Documentation.
-
Run Diagnostics on
-
Originating Server - Choose this option to run the
diagnostics on the originating server. You must have a
working connection with the originating server if you
choose this option.
-
Alternate Server - Choose this option to run the
diagnostics on an alternate server, and enter the details
of your server.
Note:
In order to run the diagnostics on an alternate
server, the alternate server must also contain the application
that generated the events.
- By default, the event will
be debugged on the server according to the server address
defined in the event file.
To debug on a different server, select the Alternate Server
option and enter the address for the alternate server.
Ensure the server on which you are running the debug session
is configured to run remote debugging sessions. See Setting
Up Remote Debugging for more information.
Note:
By default, a server
defined on a local machine will have the server URL "localhost/127.0.0.x".
If the address configured for the server from which the file was
exported is configured as localhost, selecting the Originating
Server option will run the debug session on the localhost server
of the machine on which Zend Studio
is located, which could be different than the server from which
the event was exported. In this case, to debug the event on the
originating server select the Alternate Server option and enter
the URL of the originating server,
- Mark the 'Add debug session
to debug history menu' checkbox for the debug session to be
available from the debug menu.
- Click Finish.
The debug session will launch. See Running and Analyzing
Debugger Results for more information on running a debug
session.
|
![]()
 button.


