![]()
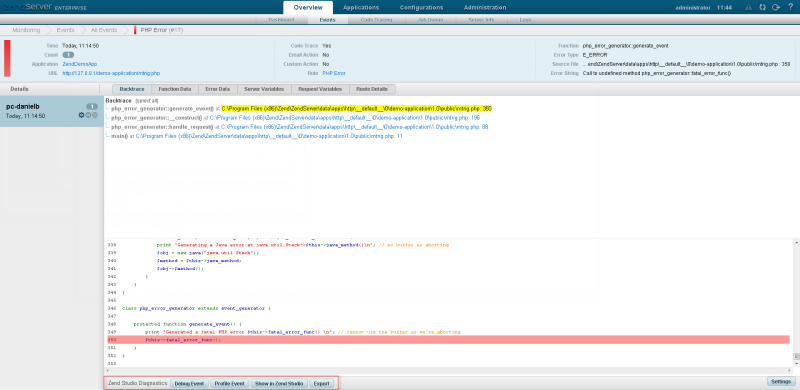
To debug an event directly from Zend Server :
-
Open your Zend Server events list.
-
Access the Events List by browsing to the Overview | Events page.
-
Select the event ID which you want to debug.
The Event Details page is displayed.
-
To select the server on which the debug/profile session will be run, in the Zend Studio Diagnostics area click
 .
.
This gives you access to the following options:
-
Originating server - This will debug the event on the server from which the event originated
-
Alternate server - Allows you to debug the event on a different server (this server must also be running the Zend Debugger). Enter the IP address of the required server.
-
Click the
 button to save your settings.
 -
Click the
 or
or
 button.
 -
The relevant debug / profile session is launched in Zend Studio.
Note:
If Zend Server cannot connect to Zend Studio , see both the see the Setting Up Zend Server Integration topic and the 'Error: Failed to Communicate with Zend Studio' topic in the Zend Server Online Help for more information.
See Running and Analyzing Debugger Results for more information on running a debug session or the PHP Profile Perspective topic for more on the information displayed once a Profile session has been run.


