Statistics
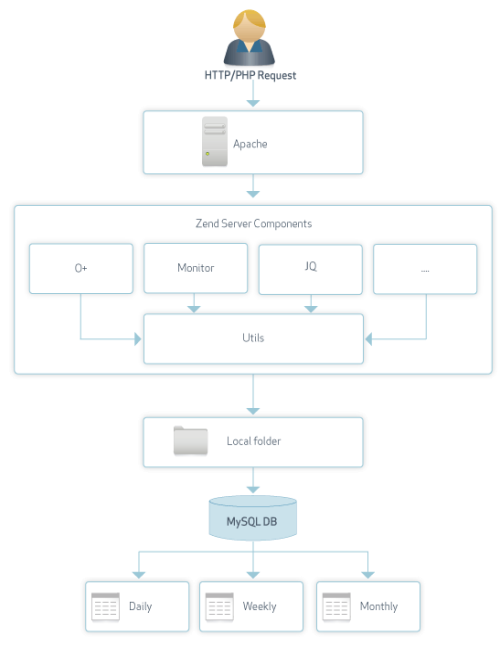
The Zend Statistics component is an additional monitoring tool that collects and displays important statistical data in the UI, enabling you to closely keep track on how your deployed applications and servers are performing. This information is collected by the various Zend Server components, and reflected in a series of metrics displayed in graphical charts on the Dashboard page.
How do I work with Zend Statistics?
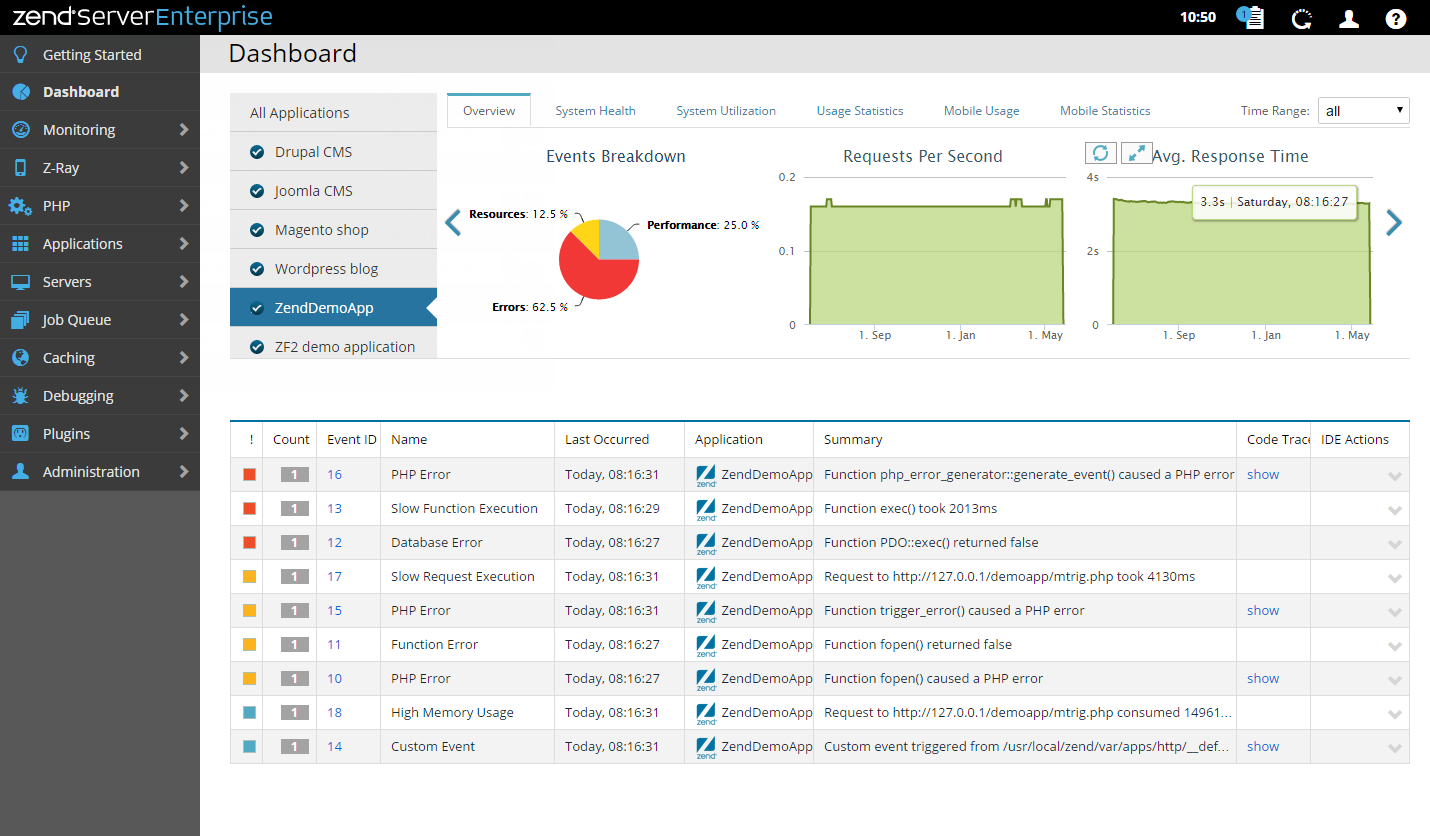
The collected data is shown in the Statistics Gallery on the Dashboard page, in a series of graphical charts that are displayed on six separate tabs: Overview, System Health, System Utilization, Usage Statistics, Mobile Usage and Mobile Statistics. By default, these charts display information for all the deployed applications on your server. You can filter the displayed information by selecting an application from the Applications List. The charts will then display information only for the selected application. The information can also be filtered by selecting a time range ![]() .
.
Behind the Scenes
The Zend Server components are responsible for reporting and gathering the data displayed in the UI. The data is aggregated by the components and placed on your disk in the form of binary files. The data is then gathered by the zdd (Zend deployment daemon) and converted into entries in three tables on the your server's MySQL database. These tables represent the time resolution in which the data is stored (daily, weekly and monthly). Outdated data (For example, data older than a month for the monthly table) is deleted and replaced by newly aggregated data.