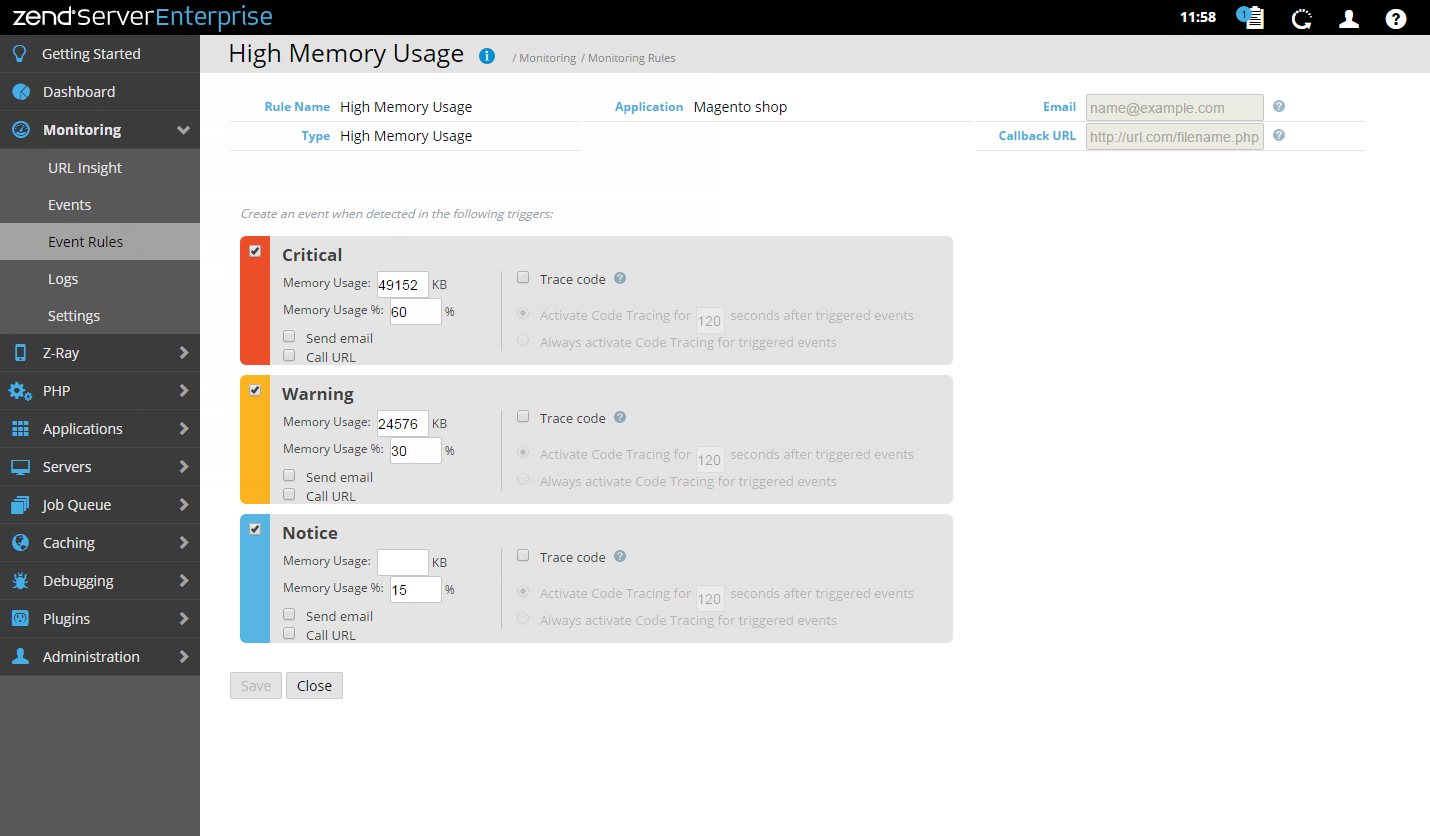
New/Edit Event Rules
The New/Edit Monitoring Rule page is accessed from the Event Rules page by selecting a rule from the rules list , or by clicking New Rule  on the group line, and is used to add a new rule or edit an existing rule.
The Action bar is located at the bottom of the page, and is used to save rules and close the page.
|
Name |
Button |
Description |
|
Save |
|
Saves the new or edited rule. |
|
Close |
|
Closes the page and displays the Event Rules page. |
The General Details area is located at the top of the page, and is displays the rule's general properties:
- Rule Name - A descriptive name for the event.
- Type - The type of event this rule generates.
- Group - The rule group (Global or Application).
- Email - The email address for receiving notifications each time the event is triggered.
- Callback URL- A URL for a script to be executed each time the event is triggered.
The Triggers and Functions area is located below the General Details area, and is used to display and configure the rule's triggers - thresholds, severity levels, triggered actions and functions.
Triggers
The rule triggers are displayed in containers listed according to their severity level (Critical, Warning, Notice). The containers hold the trigger attributes (e.g., Memory Usage) and thresholds (e.g., 8192), and a list of triggered actions (Trace Code, Send email, Custom actions) to be executed when the event is triggered.
The displayed trigger attributes and thresholds in the containers vary according to the rule type, and can be configured according to your personal preferences. See Working with Event Rules for information on working with triggers.
Functions
The functions to be monitored by the rule are displayed in a list to the right of the trigger containers:
- Add Function
 - Add a function to be monitored in the adjacent field.
 - Delete Function
 - Stop a function from being monitored.


