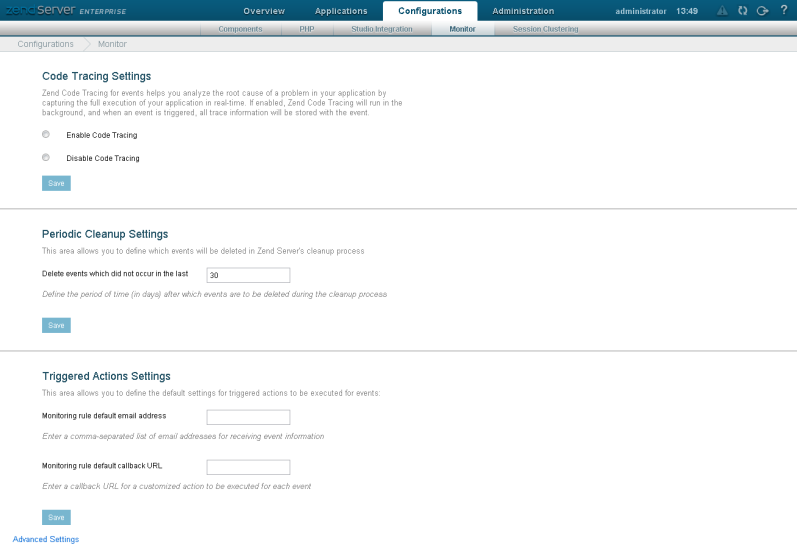
The Monitor page is accessed from Configurations | Monitor, and contains general configuration settings for the Zend Monitor component.
This Zend Server component integrates into your PHP runtime environment and watches for various events such as errors, failing functions, slow scripts, database errors, etc. When an event occurs, the Zend Monitor collects and reports all the relevant debugging information.
How do I configure the Zend Monitor?
This area allows you to set the activation options for running code tracing for events:
Important:
If enabled, you will also need to activate Code Tracing for the specific monitoring rule triggering the event you wish to collect trace information for. For more information, see Activating Code Tracing for a Monitoring Rule below, and Working with Monitoring Rules.
This area allows you to define which events will be deleted in Zend Server's cleanup process, which is run every 24 hours to delete old events:
This area allows you to define the default triggered action settings for monitoring rules:
Monitoring rule default email address - A comma-separated list of email addresses for receiving event information from the Zend Monitor.
Note:
Entering different values for a specific monitoring rule on the New/Edit Monitoring Rules page overrides the default settings set on this page.
Clicking this link will lead you to the Zend Monitor directives on the Configurations | Components page, for advanced configurations.
