In this Topic Hide
To access this page, go to Monitor | Events and select an issue ID from the list.
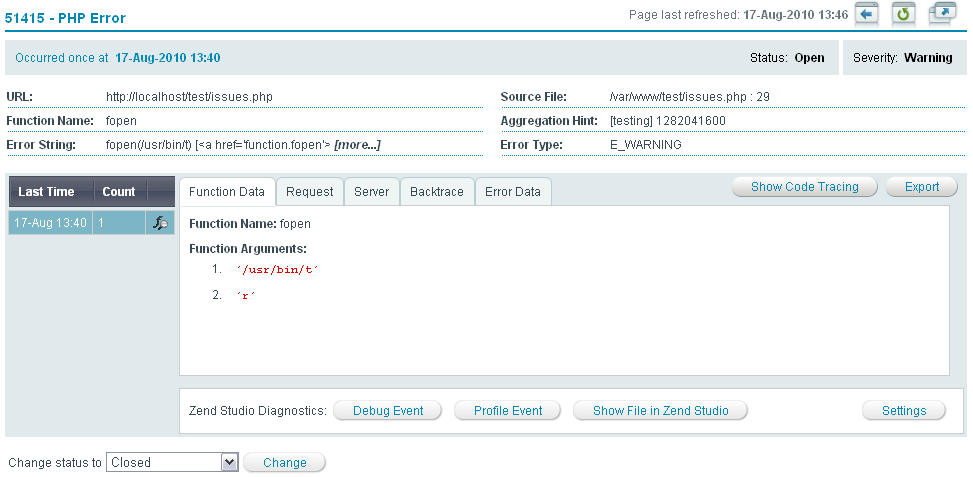
This page shows aggregated details regarding the events that triggered a specific rule. The details include audit trail information and options for investigating and resolving issues.
For a more detailed description of events and issues, see Monitor.
The actions in the issue details page can be divided into two categories:

The following actions can be applied in an issue.
Return to the Events page.
To return to the Events page, click Return ![]()
Refresh an issue's details.
To refresh an issue, click Refresh ![]()
This procedure describes how to detach an issue. Detaching an issue is the process of opening an issue in a new popup window. This feature can be used to display several events at the same time.
|
|
|
|
|
To detach an event:
|
|
Once an issue is detached, it cannot be re-attached. This process can be repeated to open several issues at the same time. |
|
Issues contain different types of information and actions that allow you to detect the source and drill down to investigate what caused a problem. In some cases (and depending on the type of event that happened), the information also indicates the solution. For example, issue information includes the exact line of code that has a problem and the nature of the problem.
The first layer of issue details are the basic details. These details are used to identify an issue with high-level characteristics. Every issue includes the following basic details:
Each issue is an aggregation of one or more events with common, predefined characteristics. These common characteristics are displayed in the General Details section. Therefore, you can assume that each event that occurred for this issue has at least these details in common. This is the first step in identifying the source of the event and understanding the circumstances surrounding the event.
Grouping is yet another additional aggregation layer applied to an issue. Inside a single issue, events are divided into groups according to the time they occurred. A new group is created only if there was no activity for at least five minutes. If a new event occurs after five minutes have passed, a new group is added to the issue.
Note:
When you use these actions, make sure that you have Zend Studio on the remote machine, access to the remote server and that the remote server is an allowed host. For more details, see Error: Failed to Communicate with Zend Studio.
The Export option creates a file with a .zsf prefix that contains all the information collected for the event. This includes and Basic and General Details of a specific Group.
If Zend Code Tracing data was collected for the group (see Setting a Monitor Rule to Run a Code Trace), it will also be included in the exported file.
This file can then be viewed in Zend Studio's Integration section. The "Export" feature allows you to export all the data related to an event as a file that can be opened in Zend Studio for further analysis. Examples of analysis are, executing a debugging session based on the event context information, or viewing and analyzing relevant Code Tracing information, again only if such information was captured by the server.
The flexibility of creating a file means that you can easily email the file to be opened in a Zend Studio that does not have any connection to a server. This can be useful for diagnosing sensitive trace information and preserving security protocols.
For instructions on exporting Zend Code Trace information to a Trace file see Exporting Trace Information.
Some events may not include this option, This only happen in events that collect information that is not relevant for debugging.
This option is only available if you have Zend Code Tracing set for the Event, see Setting a Monitor Rule to Run a Code Trace.
The Show Code Tracing option opens the Zend Code Trace Tree and Statistics views for the specific trace information collected for the event you are in.
The Change Status option provides an easy way to manage issues. Issues that are assigned an appropriate status can be efficiently filtered to control which issues to display in Monitor | Events.
The following summary describes what happens to issues when they are created and what happens when new events are added to issues that have a changed status.
|
|
|
|
|
To change an issue's status:
|
|
The status in the basic details area and in Monitor | Events will be changed accordingly. |
|
|
|
|
|
|
Related Links: Events |
|
|
|