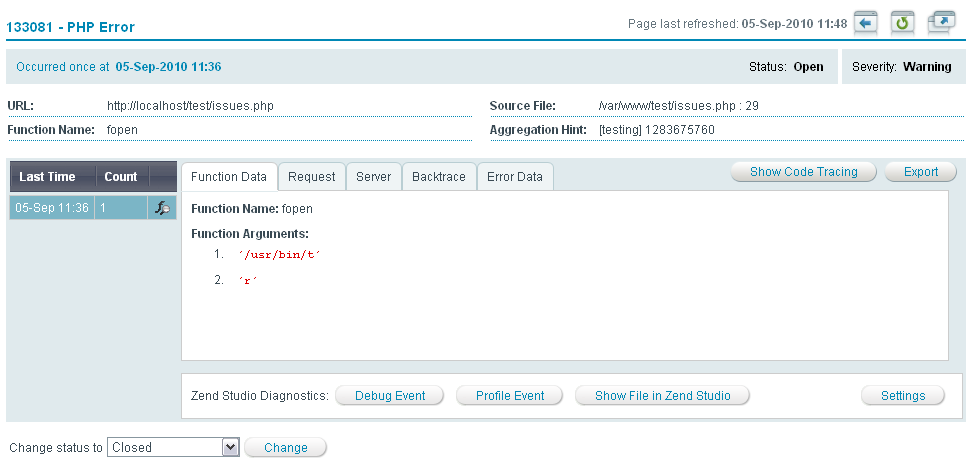
Event Details
The Event Details page is accessed from Monitor | Events by selecting an event from the list and clicking on the row.
The Event Details page is the main display area for information regarding the occurrence of a specific type of event.
Information on how an event is triggered is presented in .

Note:
Not all events display the same information. Only information relevant to the specific event type will be shown.
The following actions can be performed from the Event Details page:
 Back to Events - Returns to the Events page.
 Refresh - Refreshes the report. Refreshing the report updates the event counter if the event occurred additional times.
 Detach - Opens the report in a new browser window.
- Change Status - Changes the status of the event displayed. For a complete explanation of event handling, see .
On the Event Details page, users can view a general summary of an occurrence, its status and diagnose the occurrence with Zend Studio for Eclipse.
Event Detail - Information
The following list describes the information types displayed in the Event Details Page
Top Bar:
- Number of Occurrences - The accumulated amount of times the event was triggered between the first time the event occurred and the last time the event occurred. Refreshing the report updates this number if the event occurred additional times.
- Status - The status if the event: Open, Closed, Reopened and Ignored. For a specific event, the status can be changed in the Event Details page: For multiple events, the status can be changed in the Events page.
- Severity - The severity of the event (Warning or Critical). The severity is defined in the event's master settings in the Monitoring tab.
Event Details Table:
Events are aggregated into groups based on the time they occurred. The aggregation is set to five minutes: Thus, all the events that occur within that time frame are grouped together. Each time a set of events is aggregated (i.e., a new group is created), the occurrence details are collected again. To view the event occurrence details for a group, click on the group in the Event Details table: The display on the right will change to display the following options.
The Event Details Table options are:
- Last Time - when the last event in this group occurred
- Count - the number of events triggered in the same time frame (set to five minutes)
 - an indicator that trace information was collected for that occurrence.
Clicking on one of these options updates the display with the relevant information.
Event Details
The Event Details are a collection of information relevant to the event that occurred. Clicking on a time in the table on the left (Event Details Table) will display the information relevant to the selected occurrence/es. Through this you can find out for example, if a different function caused the error or if a different message was thrown.
The following list presents the possible details that can be displayed for a specific occurrence:
- Export - generates an XML file containing the selected event's information.
- General Data - Displays information about the event: The data changes according to the event type.
- Function Data - Displays information on the function that triggered the error, including the function name and arguments.
- Request - Displays information about the request. The superglobals (POST, GET and COOKIE) are always displayed. The other parameters (RAWPOST and FILE) are displayed only when there is relevant information to display.
- Server - Displays the superglobals SERVER and ENV when there is relevant information.
- Session - Displays the superglobal SESSION when there is relevant information.
- Backtrace - Displays all the function calls that were made before the event was triggered, including the relevant files for each function.
- Error Data - Displays the PHP error and the Java backtrace if there was a Java exception.
- Custom Variables - Displays information for a custom event (i.e., class and user-defined information that was passed to the event when it was triggered).
- Job Queue - Job Queue related events display the reason the Job generated an event.
- Code Tracing - Code Tracing related events display the reason that Code Tracing g4eenrated and event.
- Zend Studio diagnostics - Displays the actions can be applied to event details if Zend Studio for Eclipse (ZSE) is installed and Zend Server for IBM i is configured to communicate with it:
-
- Debug Event - Initiates a debug session for the event URL in ZSE.
- Profile Event - Profiles the event URL, using the ZSE Profiler with the same parameters (GET, POST, COOKIE, HTTP headers, etc.).
- Show File in Zend Studio - Opens the file where the event occurred in Zend Studio. This option makes it possible to use Zend Studio to edit files and implement changes for multiple servers.
- Settings: through this option you can choose to apply the Studio Integration actions to the Originating Server (the server on which the event was triggered) or to an Alternate Server (a different server running the same environment).Additional configuration settings are set in Server Setup | Monitor.

