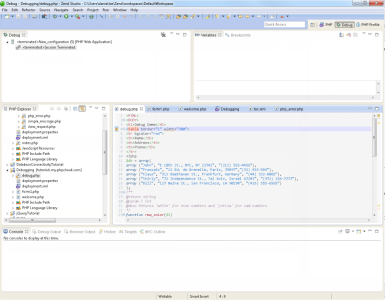
PHP Debug Perspective
The PHP Debug Perspective can be launched automatically when a Debug session is run. It contains views which allow you to control and monitor the debugging process.
By default, the PHP Debug Perspective contains the following views:
-
Debug View - Here you can control (stop, pause, and resume) the debugging process. You can also decide whether to step into, step over or step return (step out of) certain functions.
- Servers View - Displays a list of all servers configured in Zend Studio.
-
Variables View - Displays the various variables in your script.
-
Breakpoints View - Displays the breakpoints you have entered.
-
Expressions View - Displays the progress of selected variables. The view will only be displayed if you have selected to watch a variable.
- Outline View - Displays all PHP elements and element types in the current active file.
-
Console View - Displays any error and warning messages.
-
Tasks View - Displays tasks that were added to your script (if applicable).
-
Debug Output View - Displays the textual output of the script. This will be updated as the debugging process continues.
-
Browser Output View - Displays the output of the script to a browser. This will be updated as the debugging process continues.
Note:
By default, a dialog will appear asking whether you want to open the Debug Perspective when a debugging session is run. To change this behavior, open the Perspectives Preferences dialog by going to Window | Preferences | Run/Debug | Perspectives and select Always, Never or Prompt in the 'Open the associated perspective when launching' category.


