User Guide > Tasks > Working with Plugins > Working with the Ajax DOM Inspector View

Working with the Ajax DOM Inspector View

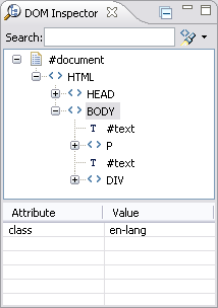
The DOM Inspector view provides a pre-defined hierarchal tree of HEAD and BODY elements. The information is according to the URL displayed in the Internal Web Browser. The nodes can be expanded to view their child nodes thus allowing you to see as many or as few of the nodes at any given time. The attributes and values of the selected node appear in the view as well.


The DOM Inspector view allows you to do the following:

Ajax DOM Inspector View

Highlighting a Node in the Internal Web Browser

This procedure describes how to highlight a node in the Internal Web Browser using the DOM Inspector hierarchal tree. This allows you to see how a node appears in the browser.


Instructions on how to complete a procedure

To highlight a node in the Internal Web Browser:

  1. Go to Window | Open Perspective | Web Browser Tools.

  2. Click Open a URL in the Mozilla Browser from the main toolbar.
    The “Open URL…” dialog opens.

  3. Enter a URL in the “Enter URL…” text field and press Enter.
    The URL opens in the Internal Web Browser.  

  4. Open the DOM Inspector view.
    A hierarchal tree of the nodes appears with the attributes and values table below.

  1. Select a node.
    If the node is visually expressed, it will be highlighted in the Internal Web Browser.
    If it is not a visually expressed DOM element you can investigate it further by opening the DOM Source view to see the element in HTML format.

You can also highlight a DOM element in the DOM Inspector hierarchal tree by selecting it in the browser. For more information see Enabling the Ctrl + Click functionality.

Managing DOM Attributes and Values

This procedure describes how to manage DOM attributes and values in the DOM Inspector view. This allows you to add, edit, and remove the attributes and values of a node.


Instructions on how to complete a procedure

To manage DOM attributes and values:

  1. Go to Window | Open Perspective | Web Browser Tools.

  2. Click Open a URL in Mozilla Browser from the main toolbar.
    The “Open URL…” dialog opens.

  3. Enter a URL in the “Enter URL…” text field and press Enter.
    The URL opens in the Internal Web Browser.  

  4. Open the DOM Inspector view.
    A hierarchal tree of the nodes appears with the attributes and values table below.

  1. Select a node. If the node has attributes and values they will appear in the table.

Note:

Any node is capable of having attributes. As it is not required, not all DOM elements do.

  1. Select the value or attribute you would like to manage.
    If you would like to add an attribute or value, it is not required to select one in the table.

  2. Click on the attribute column and from the “right click menu” select Add, Remove, or Edit.

  • If you have chosen Add, the “Add DOM Attribute” dialog opens. Enter the relevant information in the dialog and click OK.

  • If you have chosen Remove, the component is removed.

  • If you have chosen Edit, the “Edit DOM Attribute” dialog opens. Enter the relevant information in the dialog and click OK.

The attribute or value has been managed.


Evaluating a Node

This procedure describes how to evaluate a node in the DOM Inspector view using the JavaScript view in the Web Browser Tools perspective.


Instructions on how to complete a procedure

To evaluate a node:

  1. Go to Window | Open Perspective | Web Browser Tools.

  2. Click Open a URL in Mozilla Browser from the main toolbar.
    The “Open URL…” dialog opens.

  3. Enter a URL in the “Enter URL…” text field and press Enter.
    The URL opens in the Internal Web Browser.  

  4. Open the DOM Inspector view.
    A hierarchal tree of the nodes appears with the attributes and values table below.

  1. Select a node and right click.
    The “right click menu” opens.

  2. Select “Evaluate Node”.
    The JavaScript view opens with the node evaluation output.

For more information on evaluating nodes see the JavaScript view.

Comparing a Node

This procedure describes how to compare nodes in the DOM Inspector view using the DOM Compare view in the Web Browser Tools perspective.


Instructions on how to complete a procedure

To Compare a node:

  1. Go to Window | Open Perspective | Web Browser Tools.

  2. Click Open a URL in the Mozilla Browser from the main toolbar.
    The “Open URL…” dialog opens.

  3. Enter a URL in the “Enter URL…” text field and press Enter.
    The URL opens in the Internal Web Browser.  

  4. Open the DOM Inspector view.
    A hierarchal tree of the nodes appears with the attributes and values table below.

  1. Select a node and from the Right Click Menu select “Compare Node”.
    The DOM Compare view opens with the node already inserted in the “Compare List:” field. (To add another node to compare, simply repeat step 5 with the additional node or nodes.)

  2. Highlight the nodes to compare in the “Compare List:” field.

  3. In the “Compare:” field choose from the following:

  • DOM Attributes - To compare the DOM attributes of the selected nodes.

  • Child Nodes - To compare the child nodes of the selected nodes.

  • CSS - To compare the CSS properties of the selected nodes.

  1. Press Compare.
    The details appear in the Dom Compare view organized by columns. Each column is for a different node.

To clear nodes from the “Compare List:” field, click Remove Node Icon to remove only one node or Clear Entire List Icon to remove the entire list.

For more information on comparing nodes see the DOM Compare view.

DOM Inspector View Icons

The DOM Inspector View includes the following icons:

Collapse DOM Tree

Collapse the DOM tree Body element.

Filter DOM Elements by Name

Filter DOM elements by name. Use the drop-down menu to change the filtering criteria.  

Filter DOM elements by ID

Filter DOM elements by ID. Use the drop-down menu to change the filtering criteria.

Filter DOM Elements by Class

Filter DOM elements by class. Use the drop-down menu to change the filtering criteria.


Related Links:
Ajax Tools

Working with the Ajax Browser Console View

Working with the Ajax Request Monitor View

Working with the Ajax DOM Source View

Working with The Ajax CSS View

Working with the Ajax JavaScript View

Working with the Ajax DOM Watcher View

Working with the Ajax DOM Compare View

Working with the Internal Web Browser

Debugging JavaScript

Working with jQuery JavaScript Library

Working with Prototype JavaScript Library

Web Browser Tools Perspective

Enabling the Ctrl + Click functionality


©1999-2013 Zend Technologies LTD. All rights reserved.