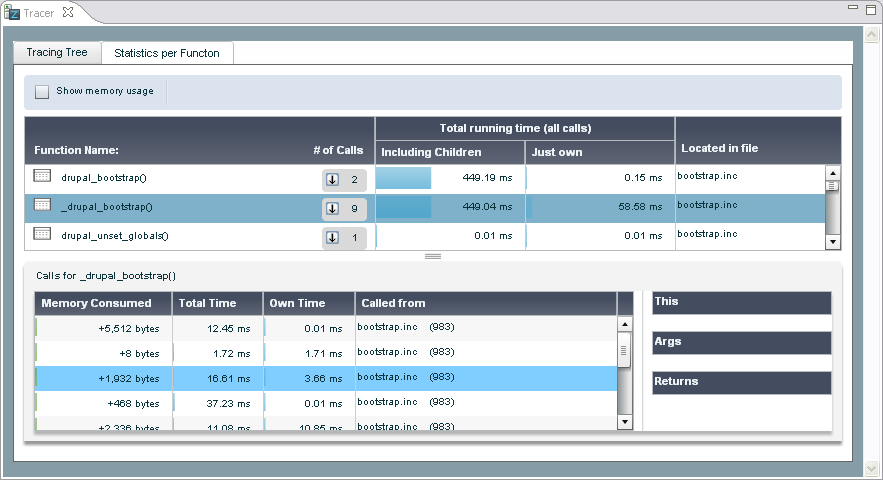
The Tracer view displays the Imported Zend Server Event File.

The Tracer view includes the following tabs:
Tracing Tree - Displays the call tree for a selected event or trace file. For more information see Code Tracing Tree in the Zend Server Online Documentation.
Statistics per Function - A table based display that provides a statistical perspective of the data captured in the request. For more information see Code Tracing Statistics in the Zend Server Online Documentation.
Note:
The Tracer View is displayed by default as part of the Debug Perspective. To manually open the view, go to Window | Show View | Other | Zend Servers | Tracer.
|
|
|
|
|
Related Links:
|
|
|
|
©1999-2013 Zend Technologies LTD. All rights reserved.
