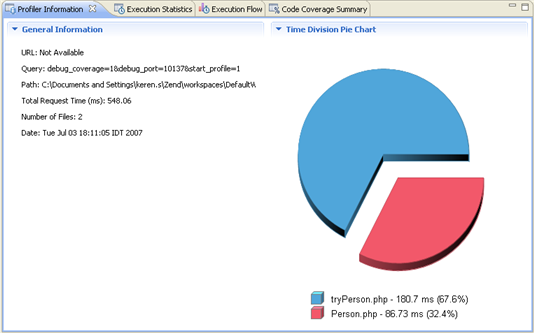
The Profiler Information view provides general information about profiling sessions such as: duration, date, number of files constructing the requested URL and more. In addition, a Pie Chart is generated that shows the time division of the files in the URL.
The right side of the view displays time division in a pie chart and the left side provides the following information:
URL - The URL analyzed (if applicable)
Query - The specific query parameters
Path - The location of the first file called
Total Request Time - Total processing time for the entire page
Number of Files - Number of files processed
Date - Date and time that the profiling took place
Note:
The Profiler Information View view is displayed by default as part of the Profiling Perspective. To manually open the view, go to Window | Show View | Other | PHP Profiler | Profiling Monitor.
|
|
|
|
|
Related Links: |
|
|
|
![]()
©1999-2013 Zend Technologies LTD. All rights reserved.
