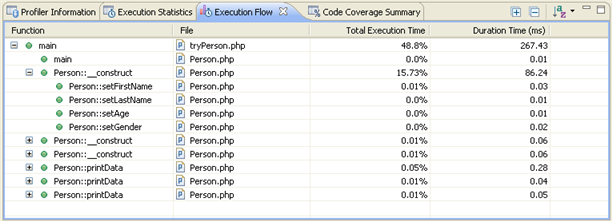
The Execution Flow view shows the flow of the execution process and summarizes percentages and times spent on each function.
The view displays the following information for each function:
Function - Function name.
File - The file in which the function is located.
Total Execution Time - Percent of time taken per function.
Duration Time - Time taken per function. In milliseconds.
Right-clicking a function in the list gives you the option to:
View Function Call - Opens the selected function call in the editor.
View Function Declaration - Opens the selected function declaration in the editor.
Open Function Invocation statistics - Opens a view with statistics about the selected function, the functions which the selected function was invoked by, and the functions invoked by the selected function.
|
Icon |
Name |
Description |
|
|
Expand/Collapse all |
Expands/collapses the list. |
|
|
'Show as Percentage' |
Toggles the view to show your times in seconds or percentages. |
|
|
Sort Profile Sessions |
Click the arrow next to the Profile Session to sort the Profile Session list by the Order in which the functions were executed or by Duration Time.
|
Note:
The Execution Flow view is displayed by default as part of the Profiling Perspective. To manually open the view, go to Window | Show View | Other | PHP Profiler | Execution Flow.
|
|
|
|
|
Related Links: |
|
|
|
![]()
©1999-2013 Zend Technologies LTD. All rights reserved.
