The Breakpoints view displays and allows you to monitor and control the breakpoints set in the files being debugged.
            
        
| 
                     Icon  | 
                
                     Name  | 
                
                     Description  | 
            
| 
                     
                          | 
                
                     Remove Selected Breakpoints  | 
                
                     Removes the selected Breakpoints from the file.  | 
            
| 
                     
                          | 
                
                     Remove All Breakpoints  | 
                
                     Removes all Breakpoints from the file.  | 
            
| 
                     
                          | 
                
                     Show Breakpoints Supported By Selected Targets  | 
                
                     If selected, only breakpoints supported by the current 'debug target' will be displayed. For example, iIf a PHP file is being debugged, only PHP breakpoints will be displayed.  | 
            
| 
                     
                          | 
                
                     Go to File for Breakpoint  | 
                
                     Opens the resource in which the breakpoint is located.  | 
            
| 
                     
                          | 
                
                     Skip All Breakpoints  | 
                
                     If selected, all breakpoints will be skipped and execution will not stop.  | 
            
| 
                     
                          | 
                
                     Expand All  | 
                
                     Expands all items in the list.  | 
            
| 
                     
                          | 
                
                     Collapse All  | 
                
                     Collapses all items in the list.  | 
            
| 
                     
                          | 
                
                     Link with Debug View  | 
                
                     If selected, clicking a breakpoint will link with the Debug view.  | 
            
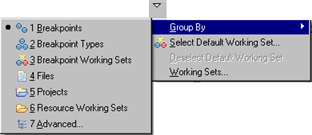
The view's menu can be accessed through the view menu icon 
.
            
        
| 
                     Name  | 
                
                     Description  | 
            
| 
                     Group By  | 
                
                    
  | 
            
| 
                     Select/Deselect Default Working Set  | 
                
                     Allows you to choose the default breakpoint working set from the Default Working Set dialog.  | 
            
| 
                     Working Sets 
  | 
                
                     Opens the Working Sets dialog.  | 
            
Note:
The Breakpoints View [Debug Perspective] is displayed by default as part of the Debug Perspective. To manually open the view, go to Window | Show View | Other | Debug | Breakpoints.
| 
                     
  | 
                
                     
  | 
            
| 
                     
                          | 
                
                     Related Links:
                         Debug View [Debug Perspective] Variables View [Debug Perspective] Expressions View [Debug Perspective] Debug Output View [Debug Perspective]  | 
            
| 
                     
  | 
                
                     
  | 
            
©1999-2013 Zend Technologies LTD. All rights reserved.