Code tracing
Code Tracing allows you to diagnose production issues that resulted in monitoring events and provides a tree of all function calls made in a request including timings, memory usage, function arguments and return values, and much more. It allows you to determine the context of why an event was triggered, which you can use to help diagnose an issue. This may be done to profile an application to determine where performance bottlenecks occur.
For example, you may use it to determine what code is taking the most amount of time or using the most memory. Another use case for traces is to determine the root cause of a production error. Due to the fact that traces contain the full context, including the code that invoked a function and the arguments to the function, platform engineers and DevOps personnel can get insight into the root cause of a production issue, allowing them to reproduce it for automated testing.
Code Tracing is tied directly to Monitoring; you may configure your Monitoring event rules to Trace code. When that event rule is triggered, ZendPHP's ZendHQ extension captures a code trace and sends it to your ZendHQ node. You can then find it either in the Code Tracing section of the UI, or linked via the triggered Monitoring event.
Quick start
The first step is to configure one or more Monitoring event rules which allows you to generate a code trace:
-
Create a new Monitoring event rule, or edit an existing rule.
-
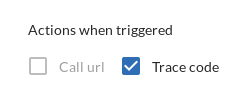
In the create/edit rule drawer, when choosing a severity level for the rule, select Trace code under the Actions when triggered heading:
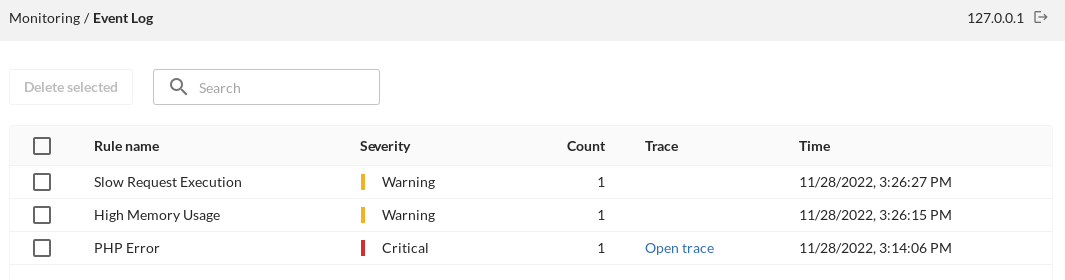
Once configured, when a rule is triggered, you will see a link to Open trace in the Trace column of the Monitoring Event Log:
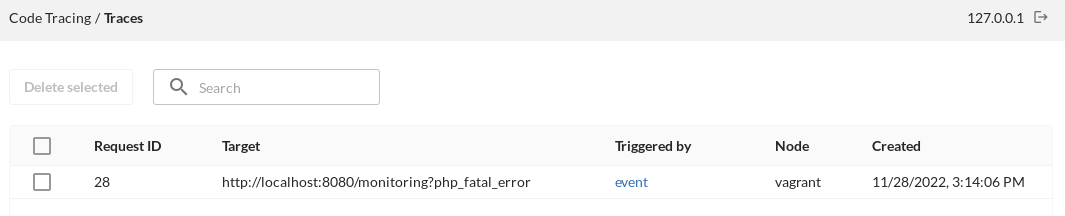
Alternately, you can go to the Traces list, and click on a trace row to open that trace:
Worke with code traces
Find code traces
Traces show up in a list of code traces, and events for which a code trade exists links to the code trace itself. Webhooks are notified of the trace ID and you can search for a trace ID in the Code Tracing list. You can delete one or more traces from the list at any time, or investigate a single trace at a time.
Monitor events
Note that if an event was triggered more than once, it links to the most recent code trace.
Code tracing view
If the trace was triggered by more than one event, it does not link to the event. The trace detail view allows popping open a hover box that links to all events that link to this trace.
Search/highlight
The code tracing tree is searchable, and you can expand and collapse it as needed. The search box allows you to search for matching traces and keyword matches are highlighted to help identify the issues you want to focus on; regular expression keywords are also supported.
View a trace
After opening your Traces list, you may see a large list of production issues that you can address. To help parse the list, you can use any of the following options to help isolate particular issues of interest, as follows:
Search by time threshold
You can enter a value specified in milliseconds to highlight the events that took over a certain amount of time. This can be useful when investigating something like a slow request to help pinpoint when the slow down is happening. Note that this is an inclusive search; lines are highlighted where the exclusive time (total time of the call excluding any children) is less than the threshold.
Search by memory threshold
You can specify a value (in kilobytes) which searches your trace list and highlights the events that are a specified amount of memory or more. This can be useful to identify events that are taking up a large amount of memory, and you can use this to help investigate why this is happening for certain events. Note that this is an inclusive search; lines are highlighted where the exclusive memory change (total memory used by the call excluding any children) is less than the threshold.
Search by error
By selecting the error check box, you can highlight errors in your trace list. This can help if you have an abundance of warnings and want to focus on the critical errors that need to be dealt with immediately. When toggled, any lines that led to a PHP error of any kind, even non-fatal errors, are highlighted.
Search by keyword
By specifying a particular keyword (for example, by 'ServerRequest'), you can narrow your list of traces to a help identify how prevalent a particular issue is.
Combine searches
You can combine any of the above search tools to narrow down your issue list; this can be especially useful if you are trying to isolate a particular problem and determine where and/or why it is happening. This is very value information that can help you speed up the process of fixing important production issues. This is an "OR"-style combination, and isolates lines that match any of the criteria.
Information drawer
When you select a trace, the information drawer opens in the right-hand panel which provides specific details about the trace such as class, function, return, memory, and time. It also provides exact details of where the trace is called from, including if it was called from multiple places, which is useful when determining the source of the problem.
For an Include:
- Include: the filename passed to the "include" directive.
- Memory used
- Time for the call
- Called from: The file and line number where the function is called from.
For an Error:
- The error message
- Memory used
- Time for the call
- Where it was triggered
For a Function call:
- Instance of (if applicable - only for instance methods): Which instance of the class was used to invoke the method.
- Class (if applicable): The class in which the function is defined.
- Function name and arguments
- If the listing is too long, it is truncated, and a chevron is shown. Clicking on the chevron causes a popup to appear that shows the function name and all arguments. Select the 'copy/paste' icon to copy the full line.
- Return: The return value, if any
- Memory used
- Time: inclusive time
- Called from: the file and line number where the function was called
- "All calls...": A list of all other places the function was called within the request, along with inclusive/exclusive timings for each. Clicking on any given line will take you to that location in the trace tree.
Configuration
ZendHQ extension configuration for ZendPHP
The ZendHQ extension configuration file can be found at:
- RPM systems:
/etc/opt/zend/php{VERSION}zend/php.d/90-zendhq.ini, where {VERSION} is the PHP minor version without the dot separator (for example, 56, 71, 80, 81). - DEB systems:
/etc/php/{VERSION}-zend/mods-available/zendhq.ini, where {VERSION} is the PHP minor version including the dot separator (for example, 5.6, 7.1, 8.0, 8.1).
The following configuration settings are code tracing-specific:
- zendhq.codetracing.enable: Globally enable or disable the Code Tracing functionality. Default value is 1 (enabled).
- zendhq.codetracing.max_string_length: Maximum length of string values to store in a Code Trace. Longer strings are truncated. Default value is 48.
- zendhq.codetracing.trace_arrays: Enable array contents recording.Default value is 1 (enabled).
- zendhq.codetracing.max_array_elements: Maximum number of array elements to store in Code Trace. Longer arrays are truncated. Default value is 10.
- zendhq.codetracing.max_array_depth: Maximum depth of arrays to store in Code Trace. Deeper nesting levels are truncated. Default value is 2.
- zendhq.codetracing.max_freq: Minimum time between Code Trace collections in number of seconds. This parameter ensures that the PHP process is not overloaded by too many Code Trace requests. Default value is 1.
- zendhq.codetracing.trace_time: Enable execution time measurement. Default value is 1 (enabled).
- zendhq.codetracing.trace_memory_usage: Enable memory usage data collection. Default value is 1 (enabled).
- zendhq.codetracing.trace_source_lines: Enable source file collection. Default value is 1 (enabled).
- zendhq.codetracing.trace_internal_functions: Enable internal functions collection. Default value is 1 (enabled).
- zendhq.codetracing.trace_user_functions: Enable user functions call collection. Default value is 1 (enabled).
- zendhq.codetracing.trace_includes: Enable tracing include and require calls. Default value is 1 (enabled).
- zendhq.codetracing.trace_arguments: Enable function call argument collection. Default value is 1 (enabled).
- zendhq.codetracing.trace_return_values: Enable function return value collection. Default value is 1 (enabled).
- zendhq.codetracing.trace_exceptions: Enable PHP exception data collection. Default value is 1 (enabled).
- zendhq.codetracing.trace_write: Enable output data writing collection. Default value is 1 (enabled).
- zendhq.codetracing.trace_headers: Enable HTTP response headers collection. Default value is 1 (enabled).
- zendhq.codetracing.trace_errors: Enable PHP error collection. Default value is 1 (enabled).
- zendhq.codetracing.trace_events: Enable Monitoring Event recording. Default value is 1 (enabled).
ZendHQ daemon configuration
You can find the configuration file for the ZendHQ daemon in the file /opt/zend/zendphp/etc/zendhqd.ini. The following configuration settings are code tracing-specific:
- zendhqd.extension = zendhq_codetracing: this line must be present to enable Code Tracing support.
- zendhqd.codetracing.database_path:
Full path of the SQLITE database used for Code Tracing. Default value is
/opt/zend/zendphp/var/db/codetracing.db. - zendhqd.codetracing.path: Full path of the directory where Code Trace dump files are stored; The directory must be writable by the ZendHQ daemon process. Default value is
/opt/zend/zendphp/var/codetracing. - zendhqd.codetracing.cleanup_frequency: Code Tracing data cleanup frequency in minutes. Set to 0 to disable cleanup. Default value is 10 minutes.
- zendhqd.codetracing.history_time: Code Tracing data limit in number of days. Code Traces older than this number of days are deleted. Setting this value to 0 disables the time limit. Default value is 30 days.
- zendhqd.codetracing.history_traces: Code Tracing data limit in number of traces.If the number of traces grows larger than this value, then older traces are deleted. Setting this value to 0 disables checking the number of traces. Default value is 100 traces.
- zendhqd.codetracing.history_size: Code Tracing data limit in number of megabytes. If the total size of Code Trace traces including processed files grows larger than this value, older traces are deleted. Note that this is not a hard limit and the limit is applied only during the startup and data cleanup processes. Setting this value to 0 disables checking for the data size. Default value is 500 MB.
See also Troubleshoot code tracing.