Monitoring Settings
The Monitoring Settings page contains 3 configuration sections, General, Events and URL Insight, and can be accessed from the Zend Server UI Monitoring -> Settings menu.
To read more about the Zend Monitoring component, check Monitoring and Working with Monitoring topics.
For advanced configuration of the Monitor Component, open the UI page Administration -> Components, and click on "Zend Monitor" to open the configuration section.
The following tabs are available in the Monitoring Settings page:
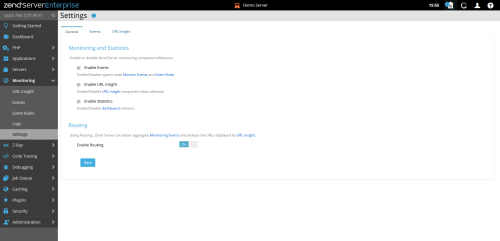
Here you have general / global settings allowing you to enable / disable the main features of Monitoring and Statistics
Monitoring and Statistics
- Enable Events - This option enables / disables event monitoring feature, including Events and Event Rules
- Enable URL Insight - This option enables / disables URL Insight feature
- Enable Statistics - This option enables / disables Statistics collection (Visible in the EventsStatisticsMonitoringDashboard page)
Routing
- Enable Routing - This option enables / disables routing analysis, affecting Monitoring Events Aggregation and URL Insight
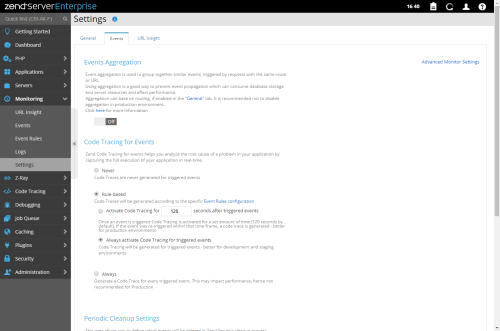
Here you configure different aspects of events monitoring
Advanced Monitoring Settings (link on the right)
Clicking this link will lead you to the Zend Monitor directives on the Administration | Components page, for advanced configurations.
Events Aggregation
- Enable aggregation - This option allows unification of "similar" events, coming from the same URL / Route, in the events list.
- Disable aggregation - This option will separate each new event as a new instance, which will result in many event records on the same URLs / Routes. This mode is better for development, where full details of each event are needed in its own focus.
Code Tracing for Events
- Never - Code Traces are never generated for triggered events.
- Rule-based - Code traces are generated according to specific Event Rules configuration. You can specify the following options:
- Activate Code Tracing - Specify the time in seconds to activate code tracing after the event is triggered. This is better for production environments.
- Always activate Code Tracing for triggered events - Code tracing is always generated when an event is triggered. This is better for development and staging environments.
-
Always - Code tracing is always generated when an event is triggered.
Periodic Cleanup Settings
- Delete events which did not occur in the last - This option configures the Monitoring Events cleanup mechanism within the Zend Server cleanup routine, basing old events cleanup on days count. Once an event has passed X days in the database, it will be permanently deleted by a periodic job, preserving disk space and DB storage. With more days to keep old events, you will get a larger storage consumption holding old events, but more time to go over old events if your admin routines are not frequent. With less days to keep old events, you will have smaller storage consumption, yet you will need to be "quicker" on your periodic checks. To make sure you do not miss out on critical events, you can always configure Event Rules with more actions, such as sending email to an admin address, or callback URL which can collect the data into other systems, such as SMS / Chat system or monitoring web service.
Triggered Actions Settings
- Monitoring rule default email address - Here you can set a default email address, or multiple email addresses separated by commas, to be selected when event rules are triggering an email action, in addition to raising an event in the system and storing in the database.
-
Monitoring rule default callback URL - Here you can set a default callback URL, to be called by Zend Server as an additional action by event rules which are defined to trigger a callback URL. Your endpoint URL script should parse the POST data from the callback information and perform further triggering / storing as your business needs / integrated systems require.
- Apply to existing monitor rules - This checkbox will re-visit existing event rules which are set to trigger Email or Callback actions, and replace the existing values with the above configuration. This can help to minimize your admin work if you already have some event rules with triggered actions defined.
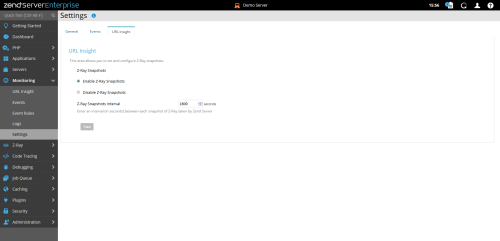
Here you can enable, disable and fine tune Z-Ray snapshots for URL Insight data collection
URL Insight
- Enable Z-Ray Snapshots - This option enables Z-Ray periodic snapshots to add more data to explore in the URL Insight page.
- Disable Z-Ray Snapshots - This option disables Z-Ray periodic snapshots
- Z-Ray Snapshots Interval - This value configures number of seconds between Z-Ray snapshots collected periodically, and depends on enough traffic on the visited URLs, to create a corresponding Z-Ray snapshot in the given time-frame.
Note:
Enabling the feature with rapid snapshot interval may result in slower performance.


