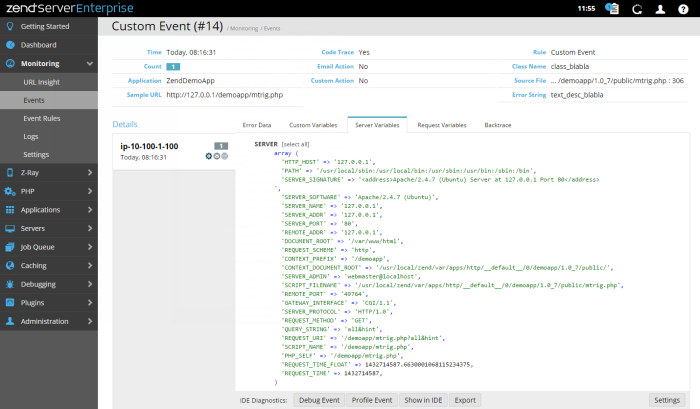
Event Details
The Event Details page is accessed from the Events page or the Dashboard page by selecting an event ID from the Events list , or by clicking More Details in an event's expanded view. The page contains all the available monitored event-related information and details, and Zend Studio diagnostic tools.
The Summary area displays general event details:
- Time - The time the event was generated.
- Severity - The severity of the event (Notice, Warning or Critical). See Event Severity Levels..
- Count - The accumulated amount of times the event was triggered between the first time the event occurred and the last time the event occurred.
- Applications - The name of the application associated with the event.
- URL - The URL of the application associated with the event.
- Code Trace - Executed and saved code trace (Yes, No).
- Email Action - Sent email (Yes, No).
- Custom Action - Executed customized action (Yes, No).
- Rule - Link to the monitoring rule triggering the event.
- Class Name - Displays information on the event class.
- Function - Displays information on the function that triggered the error, including the function name and arguments.
- Error Type - The type of the PHP error associated with the event.
- Source File - The source location of the associated application.
- Error String - The string of the PHP error associated with the event.
Note:
Not all events display the same information. Only information relevant to the specific event type will be shown.
The Details table contains all related and available event details, and includes three components:
- Groups List - Displays aggregated event groups and related information:
- Server name - Name of originating server.
- Time stamp - When the event was generated.
- Execution Time - The request execution time.
- Memory Usage - The amount of memory used.
- Number of occurrences - How many events occurred within the event group.
- Triggered actions
 - Actions that were triggered by the event: Code Trace, Send Email, Custom Action.
- Event Details tabs - Selects type of event details to display:
- Error Data - Displays the PHP error and the Java backtrace if there was a Java exception.
- Custom Variables - Displays information for a custom event (i.e., class and user-defined information that was passed to the event when it was triggered).
- Server Variables - Displays the superglobals SERVER and ENV when there is relevant information.
- Request Variables - Displays information about the request. The superglobals (POST, GET and COOKIE) are always displayed. The other parameters (RAWPOST and FILE) are displayed only when there is relevant information to display.
- Route Details - Displays the code route (controller, action) leading to the event (e.g., MonitorRules | index).
- Backtrace - Displays all the function calls that were made before the event was triggered, including the relevant files for each function.
- Function Data - Displays information on the function that triggered the error, including the function name and arguments.
- Session - Displays the superglobal SESSION when there is relevant information.
- Job Queue - Job QueueA simple and manageable system for off-loading tasks from the synchronous user request, to an external, parallel PHP process. related events display the reason the Job generated an event.
- Code Tracing - Code Tracing related Events display the reason that Code Tracing generated an event.
- Event Details display area - Displays information according to selected Event Detail tab.
Note:
Not all events display the same information. Only information relevant to the specific event type will be shown.
This area contains action items for diagnosing events using an IDE:
|
Name |
Icon |
Description |
|
Debug Event |
|
Initiates a debug session for the event URL in your IDE. |
|
Profile Event |
|
Profiles the event URL in your IDE with the same parameters (GET, POST, COOKIE, HTTP headers, etc.). |
|
Show in Zend Studio |
|
Opens the file where the event occurred in the IDE. This option makes it possible to use your IDE to edit files and implement changes for multiple servers. |
|
Export |
|
Generates an XML file containing the selected event's information and exports it to your IDE. |
Note:
These action items are only available if your IDE is installed on your machine, and Zend Server is configured to communicate with it.


