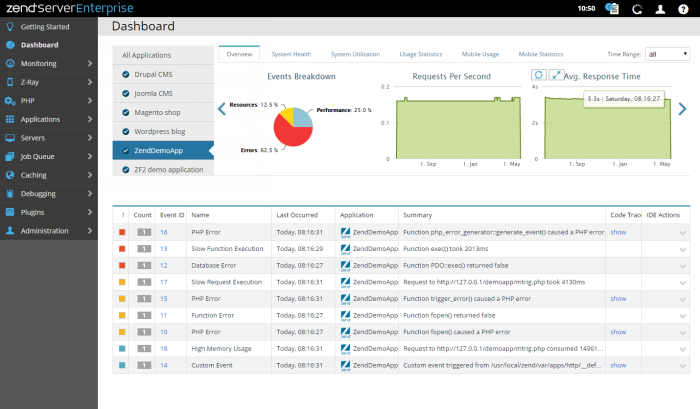
The Dashboard page is accessed from the main menu, and is the default page that is displayed after logging in to the Zend Server UI.
The Dashboard page provides you with a general system overview, containing application-specific analytic information indicating how your applications are performing in relation to expected behavior. You can use this page to quickly get started with your applications.
This section of the Dashboard page contains statistics associated with the application selected in the Applications List section.
The statistics include a series of graphical charts that are displayed on separate tabs: Overview, System Health, System Utilization, Usage Statistics, Mobile Usage and Mobile Statistics. The gallery also includes a Time Range filter - Click the drop-down menu to filter displayed data according to time range. ![]()
This section of the Dashboard page displays a list of any deployed or defined applications managed by the Zend Server UI. Information displayed in the other sections on this page is defined by the application selected from this list. To change the displayed information, just click on an application. You can scroll up and down the list in case of multiple applications.
If there are no defined or deployed application on your server, the Applications list contains quick action links to deploy or define a new application.
This section displays a list of the latest critical server eventsAn event is a collection of runtime-related information collected by the Monitor component. This information is collected when an event is triggered, according to the conditions defined by the Event Rules. associated with the application selected in the Applications List section. A complete list of events can be found in Monitoring | Events. Click an Event ID to view the full event details on the Event Details page. For a full breakdown of all the types of information displayed in the Events List, see Events


