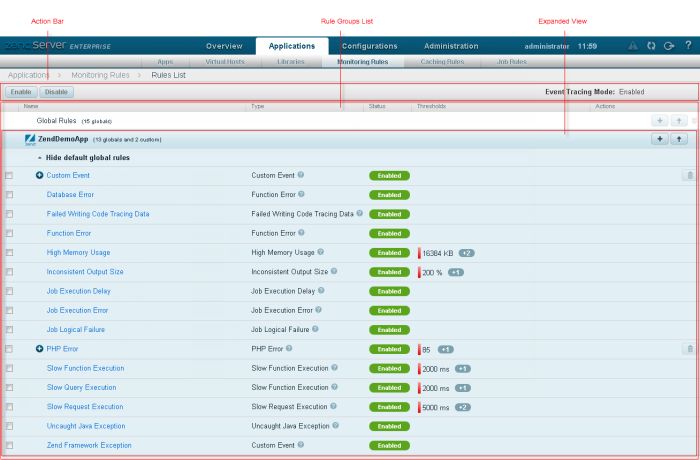
The Monitoring Rules page is accessed from Applications | Monitoring Rules, and displays and generates the Monitoring RulesZend Server Monitoring is based on a set of predefined rules that can be configured to suit your environment's requirements (such as performance thresholds) or enabled and disabled as necessary. Once Zend Server is installed, the Monitor component begins to create Events based on these rules. that trigger events. An event is a collection of runtime-related information collected by the Monitor component. This information is collected when an event is triggered, according to the conditions defined by the Monitoring Rules.
How do I work with monitoring rules?
Note:
By definition, monitoring rules function differently from one another since they are monitoring different aspects of your development and production environment. Therefore, they are displayed differently and can be configured differently. For example, the Custom Event rule does not display functions. For reference, see Global Monitoring Rules .
Monitoring rules are grouped together in Rule Groups. By default, the Global Rules group appears at the head of the list, followed by Application Rules groups. For more information on the difference between the two types of rule groups, see Monitoring Rules.
The information for each rule group is displayed as follows:
Name | Icon | Description |
Add |  | Adds a rule to the selected rule group. Displays the New/Edit Monitoring Rules page. |
Export |
| Exports the rule group to an .xml file. |
Selecting a group from the Rule Groups list, or clicking the Expand View arrow  on the right, displays a list of all the associated monitoring rules within the group. By default, application rule groups include the Global default rules. These are viewed/ hidden by clicking Show default global rules/ Hide default global rules at the top of the list.
The list of rules is sorted into columns:
 icon.
icon.
 ).
).Tip:
If there are any additional thresholds for the rule, an icon  expressing the number of additional thresholds is displayed. Hover over the icon to view these thresholds.
