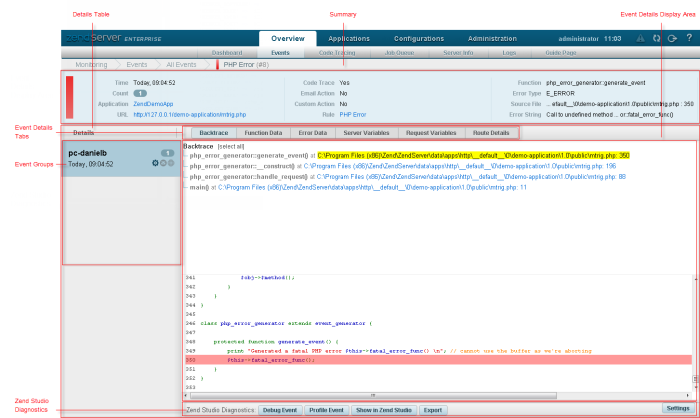
The Event Details page is accessed from the Events page or the Dashboard page by selecting an event ID from the Events list , or by clicking More Details in an event's expanded view. The page contains all the available monitored event-related information and details, and Zend Studio diagnostic tools.
The Summary area displays general event details:
Note:
Not all events display the same information. Only information relevant to the specific event type will be shown.
The Details table contains all related and available event details, and includes three components:
 - Actions that were triggered by the event: Code Trace, Send Email, Custom Action.
Note:
Not all events display the same information. Only information relevant to the specific event type will be shown.
This area contains action items for diagnosing events using Zend Studio:
|
Name |
Icon |
Description |
|
Debug Event |
|
Initiates a debug session for the event URL in Zend Studio. |
|
Profile Event |
|
Profiles the event URL, using the Zend Studio Profiler with the same parameters (GET, POST, COOKIE, HTTP headers, etc.). |
|
Show in Zend Studio |
|
Opens the file where the event occurred in Zend Studio. This option makes it possible to use Zend Studio to edit files and implement changes for multiple servers. |
|
Export |
|
Generates an XML file containing the selected event's information and exports it to Zend Studio. |
|
Settings |
|
Allows you to select the server upon which you would like to perform the Zend Studio diagnostics |
Note:
These action items are only available if Zend Studio is installed on your machine, and Zend Server for IBMi is configured to communicate with it.
