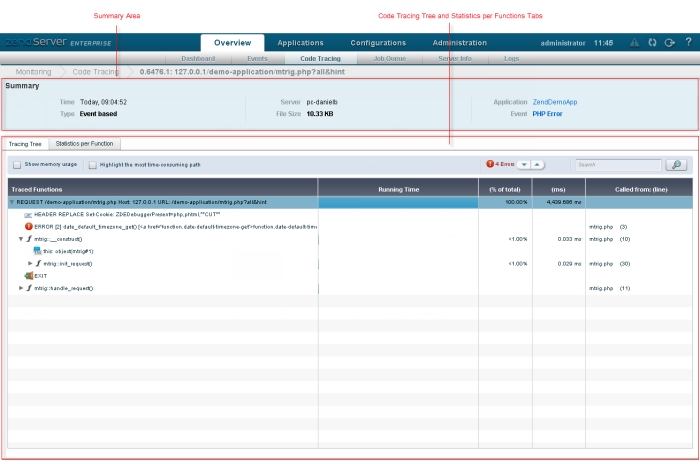
The Code Tracing Details page is displayed when selecting a trace from the Code Traces list on the Code Tracing page, and includes all available trace information, including the Code Tracing Tree and Statistics per Function tables.
This area provides a summary of the executed code trace:
The Tracing Tree displays the call tree for a selected Event or trace file.
Tree Action Bar
Tree Table Columns
Traced Functions: The name of the caught object in the trace file. This could be an argument, return value, function error, header etc.
Memory Consumed by function (bytes): The memory used by this item
Running Time: A graphical representation of memory usage pointing out the before/after function runtime values of the total memory usage and the difference between them. This allows you to see the before value, the memory consumption after the function was run and the difference i.e. the amount of memory the function added by running.
(% of total): The percentage of the total script's runtime.
(ms): The time it took for the function to run in milliseconds (including children).
Called from (line): The line of code where the event happened (in the file stated in filename).
Navigation
The Statistics per Person displays a table-based statistical perspective of the data captured in the request.
The All Functions area includes the following columns:
The Calls for Functions area includes the following columns:
When selecting an item from the “Calls for Functions” list details about the actual call are displayed if it is an object.
Navigation
Search
Enter a string in the search field  and click
  to filter the display and only show the functions that match the entered string.
|
|
|
|
|
Related Links: |
|
|
|
© 1999-2013 Zend Technologies, Ltd. All rights reserved.
