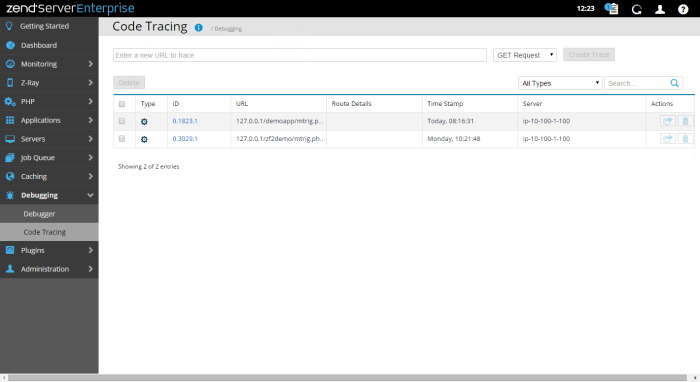
The Code Tracing page is accessed from Debugging | Code Tracing, and is the central display and management area for all traced information.
Code Tracing enables deep analysis of PHP execution and flow using drill-down requests related to an event (Monitoring Rule), or triggered manually.
How do I trigger a code trace for a URL?
How do I trigger a code trace for an event?
Which option are available for configuring the Code Tracing component?
The Trace URL bar is located at the top of the page used to manually run Code Tracing on a specific URL.
How do I manually trigger a code trace?
|
Name |
Button |
Description |
|
URL Field |
|
Contains the trace URL. |
|
Request Type |

|
Request Type drop- down menu: - GET Request - POST Request |
|
Create Trace |
|
Triggers manual code tracing for entered URL. |
The Action bar is used to delete and filter/search for existing traces.
|
Name |
Button |
Description |
|
Delete |

|
Delete an existing trace. |
|
Show |

|
Filter drop- down menu: Triggered by Code - Show traces that were triggered by executed script. Triggered by Event - Show traces that were triggered by a monitoring rule. Manual Request - Show traces that were triggered by manually-entered URLs . Triggered by Segfault- A trace triggered by a PHP Error. |
|
Search box |
|
Searches the page for the entered string. |
Executed code traces are displayed in a list. The information for each listed trace is sorted into columns:
- Type - Type of trace( Manual
 , Event-based
  , Code-based
  ).
). - ID - Linked Trace ID number. Click to view full trace details on the Code Tracing Details page.
- URL - Traced URL.
- Time Stamp - Trace date and time.
- Server - The server that executed the trace.


