Code Tracing Settings
Code Tracing Settings area has 3 tabs: Data Collection, Access Control and Advanced.
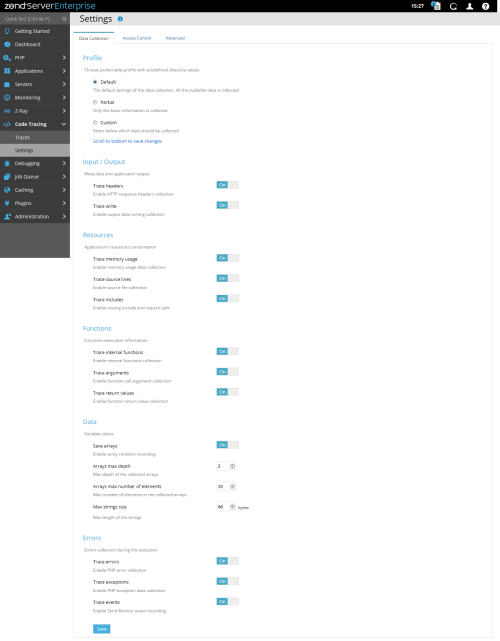
In the Data Collection setting, you will find 3 profiles to choose from, and their designated options.
Default Profile
Enables all available information for Code Trace Dumps
Partial Profile
Enables only a minimal information set, including:
- HTTP response headers
- Included / Required files
- Functions return values
- All Error options - PHP Errors, PHP Exceptions, Zend Monitor Events
Custom Profile
This option allows you to start from Partial Profile and add / remove any option as needed
Once editing is complete, click the "Save" button.
PHP Restart Required!
After Saving the Code Tracing collection profile, you will see the restart prompt. If you have more changes to apply to Zend Server configuration - go ahead and configure the specific settings pages. Once finished with configuration changes, perform the pending restart by clicking on the Orange restart icon at the top right (navigation bar actions area).
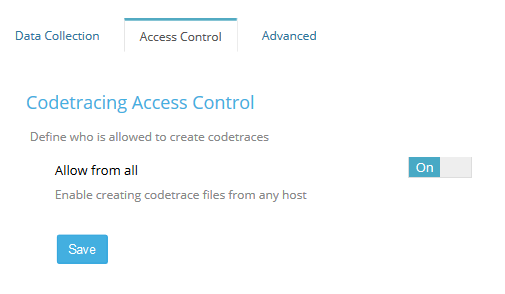
When you enable "Allow from all" (On), the networking configuration are hidden and no access restrictions are applied.
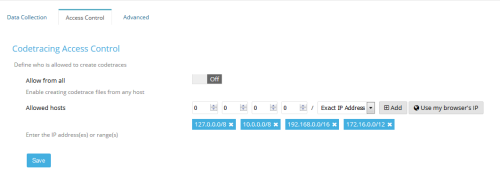
When you set "Allow from all" to Off, you will get the following networking configuration section
The Allowed hosts are basically remote IP addresses of HTTP clients (browser, web service etc.) which will create a manual Code Trace when adding ?dump_data to the GET parameters when calling a PHP script / application. If your IP / Network is not included, Code Tracing will ignore the request and run the PHP code without dumping the Code Tracing data. This also prevents rapid attacks on your PHP applications by dropping Code Tracing dumps constantly, by limiting the allowed hosts to known IP / Networks only.
To make editing easier for inserting your own IP / Network, you can click on "Use my browser IP" to populate the IP numbers, and then select the Netmask as "Exact IP Address", or one of the others - 0.0.0.*, 0.0.*.*, 0.*.*.*.
Click "Add" to add any number of IPs / Net Masks to the list. Remove any list entry by clicking on the trailing "x".
Once you done with your Allowed Hosts configuration - click "Save".
PHP Restart Required!
After Saving the Code Tracing collection profile, you will see the restart prompt. If you have more changes to apply to Zend Server configuration - go ahead and configure the specific settings pages. Once finished with configuration changes, perform the pending restart by clicking on the Orange restart icon at the top right (navigation bar actions area).
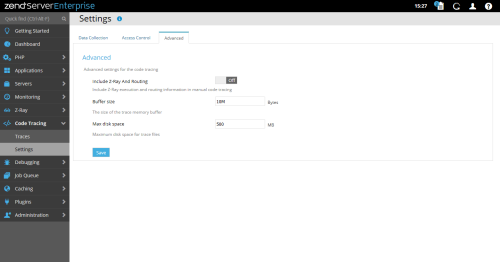
Here you can configure advanced aspects of Code Tracing, including resource limits
Include Z-Ray And Routing: When performing manual code traces from the Admin UI or by passing ?dump_data GET parameter to your application URLs, you can go through Z-Ray and Routing to collect more information to be analyzed by your developers. This feature can grow Code Tracing dump file significantly.
Notes
- The Code Tracing dump file includes Z-Ray and Routing information, if enabled. However, when viewing Code Traces in the Admin UI, a DB file is created on the same path, to visualize the information. The DB file does not include Z-Ray and Routing information, and is identical to the one created with this options disabled.
- Z-Ray information for the Code Tracing manual dump will be available in Z-Ray, i.e. - Z-Ray History page and if opened while tracing on another window - Z-Ray Live! page.
Buffer size: This option limits the amount of memory used by Code Trace before dumping the information to disk.
Max disk space: This option limits the amount of disk space which Code Trace dumps can be consuming. The default path for saving dumps is defined by 'zend_codetracing.dump_file' directive (default to data_dir/codetracing/dumpXXXX). The actual enforcement is done in the hourly maintenance script, which cleans up Code Tracing files to reduce Disk Space utilization to designation value - it does NOT match disk space outage in realtime to prevent new code traces from being written! So always keep a bit more space on Zend Server disk mount(s), just in case.
PHP Restart Required!
After Saving the Code Tracing collection profile, you will see the restart prompt. If you have more changes to apply to Zend Server configuration - go ahead and configure the specific settings pages. Once finished with configuration changes, perform the pending restart by clicking on the Orange restart icon at the top right (navigation bar actions area).


