![]()
To profile a PHP Web Page:
-
Click the arrow next to the Profile button
 on the toolbar and select Open
Profile Dialog -or- go to Run
| Open Profile Dialog from the main menu -or- right-click
in PHP Explorer view and select Open
Profile Dialog.
on the toolbar and select Open
Profile Dialog -or- go to Run
| Open Profile Dialog from the main menu -or- right-click
in PHP Explorer view and select Open
Profile Dialog. -
A Profile dialog will appear.
-
Double-click the PHP Web Page option to create a new Profile configuration.
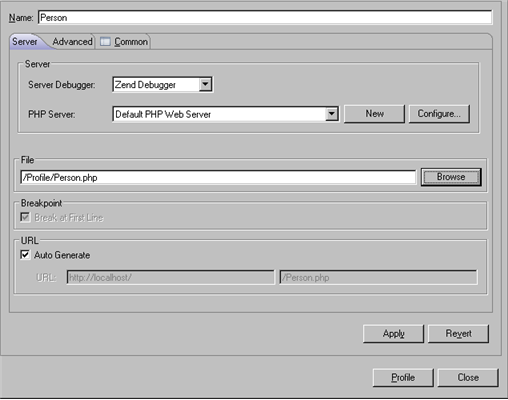
Profile PHP Web Page Configuration
-
Enter a name for the new configuration.
-
Select your server from the list.
If you have not yet configured your server, click New. The PHP Server Creation Wizard will open.
Configure your server by following the instructions on adding a new server under the PHP Servers Preferences page.
For more information on configuring the communication between Zend Studio and your remote server, see Setting Up Remote Debugging. -
Under PHP File, click Browse and select your 'debug target' file (the file from which the profiling process will start.)
-
For further profiling options, select the Advanced tab, which has the following options:
-
Open in Browser - Mark if you would like the application to be displayed in Zend Studio's internal browser
-
Source Location - Choose whether the source files used during this session will be taken from the Server or from a local copy (if a local copy is not available, files will be taken from the server according to the search mechanism detailed in the Path Mapping topic).
-
Click Apply and then Profile.
-
Click Yes if asked whether to open the PHP Profile Perspective. (If you would like the Profiling Perspective to open by default in the future, mark the 'Remember my decision' checkbox.)
The Profiling Perspective will open, displaying the Profiling Monitor window with various Profiling views.
See the PHP Profile Perspective for more on the information that will be displayed once a profile session has been run.
