Debugging JavaScript
The Zend Studio
JavaScript debugging function allows you to test your files and applications
and detect errors in your code. These procedures describe how to debug
JavaScript code live from your workspace using an internal JavaScript
Debugger.
Debugging
JavaScript in an HTML File
This procedure describes how to debug JavaScript code that is in an
HTML file. To open an HTML file go to File
| New | HTML Page.
|
|
|
|

|
To debug JavaScript in an HTML
file:
-
To
open the PHP perspective go to Window
| Open Perspective | PHP.
The PHP perspective opens.
-
In
your project directory select Debug
As | Debug JavaScript from the Right Click Menu.
The "Confirm Perspective Switch" dialog opens to
inform you that the launch will open the Debug Perspective.
-
Click
Yes.
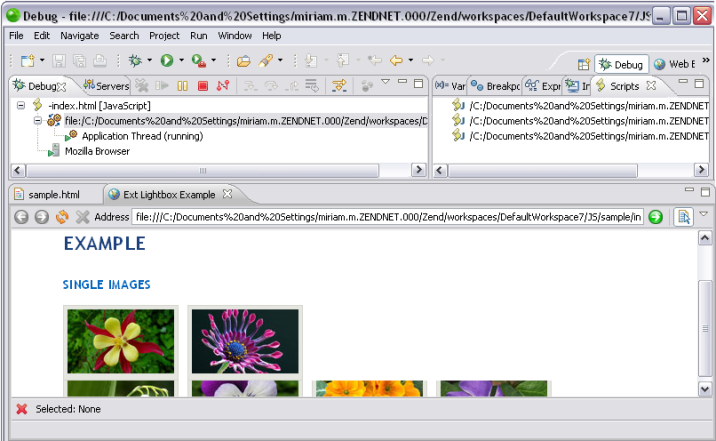
The Debug Perspective opens.

-
From
the Scripts view double click a script from the list of available
scripts.
The script opens in the editor.
-
In
the editor, set breakpoints at the relevant places in the
file by double-clicking the vertical marker bar to the left
of the editor.
-
Save
the file.
-
Click
 in the Debug View to start debugging.
Use the controls in the Debug view to manage your debugging
session.
|
|
A
number of views will open with relevant debug information.
See the Running and
Analyzing Debugger results topic for more information on the
outcome of a debugging process.
|
Note:
If the file contains 'include' or 'require' calls to
files which are not contained within the project, you must add
them to the project's Include Path in order to simulate your production
environment.
Debugging a URL
This procedure describes how to debug a URL. This allows you to debug
code according to a URL instead of a file name.
|
|
|
|

|
To Debug a URL:
-
From
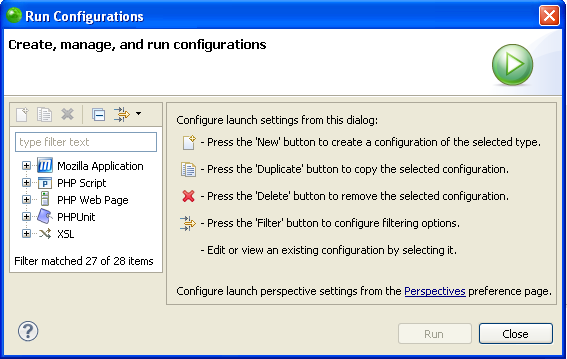
the menu bar select Run |
Run Configurations - or - From the Right Click Menu
in your project directory select Run
As | Run Configurations.
The "Run Configurations" dialog opens.

-
Double
click the Web Application node to create a new debug configuration.
-
Open
the Web Configuration tab.
In the "Debug Target" field select "URL".
-
In
the empty text field enter the complete URL.
-
Click
Apply to apply the
changes.
-
Click
Debug to debug the
URL.
The URL opens in the Internal
Web Browser and the debugging process begins.
|
|
A
number of views will open with relevant debug information.
See the Running and
Analyzing Debugger results topic for more information on the
outcome of a debugging process.
|

![]()

 in the Debug View to start debugging.

