Open topic with navigation
Working with Zend Server
The purpose of this tutorial is to teach you how to deploy, profile
and debug files and applications using the Zend Server.
Purpose and
Usage
This tutorial demonstrates how to use Zend Studio's
integration with Zend Server
in order to constantly monitor your application and easily detect and
diagnose performance issues and code errors during run-time.
Note:
You must have Zend Server
installed on your local machine before commencing this tutorial. See Zend Server Integration
for more information on the Zend Server and where to download.
Configuring
Zend Server Integration
A Zend Server installed
on the same machine as Zend Studio
is automatically detected and configured in Zend Studio.
|
|
|
|
|
To automatically configure a Zend Server :
The auto detection is triggered
when Zend Studio
is launched or when the Auto Detect Zend Server
button is clicked.
For auto detection when Zend Studio
is launched:
-
Ensure Zend Server is installed
and running on the local machine.
-
Open Zend Studio.
A popup balloon will appear in the bottom-right corner of the
window indicating that a Zend Server
installation has been detected and configured.

-
Click the  icon to close the balloon or the 'click here'
link to be taken to the Zend Server Integration help page. icon to close the balloon or the 'click here'
link to be taken to the Zend Server Integration help page.
|
|
A
Local Zend Server configuration is configured and added to your
PHP Servers Preferences page.
|
Creating
a project on a Local Zend Server
Through Zend Studio
, you can create new PHP projects directly on your local Zend Server's
document root.
Note:
Ensure you have configured
your local Zend Server integration, as described above.
|
|
|
|

|
To create a new PHP project on
Zend Server
;
-
From the menu
bar, go to File | New | PHP
Project.
The New PHP Project dialog is displayed.
-
Enter 'ZendServerProfiling'
in the project name field.
-
Under the contents
category, ensure the 'create project on a local server' option
is selected.
The directory path should point to the document root of your
Zend Server.
-
Click Finish.
The project will be created on your Zend Server's
document root.
|
|
|
Diagnosing
and Profiling Performance Issues on Zend Server
Zend Server detects performance issues in your code and stores them
as events. These events can then be profiled to diagnose the cause of
the slow performance.
|
|
|
|
|
This
procedure creates a purposeful performance issue in order to demonstrates
how to profile an event:
-
Create a new PHP
file in the project you created above by right-clicking the
project in PHP Explorer view and selecting New
| PHP File.
-
Name the file
c-to-f_convert.php and click Finish.
-
Copy/paste the
example code into the file.
(Click
here to see the code)
(See the "Working
with Zend Server" Tutorial in Zend Studio's
Online Help for the example code.)
-
Save the file.
-
Run the application
you created by right-clicking the c-to-f_convert.php file
in PHP Explorer view and selecting Run
As | PHP Web Page.
The Run PHP Web Page dialog is displayed.
-
Ensure the URL
in the Launch URL field points to the location of your file
on Zend Server
and click OK.
The application is launched in Zend Studio's
browser.
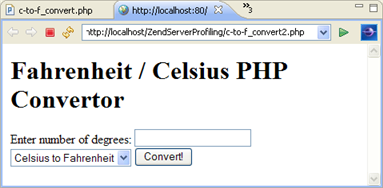
-
In the temperature
field, enter '30' and click the Convert!
button.
Because the code used for this application contained a purposeful
slowdown, this action should have been detected by Zend Server and saved as
a performance event.
-
Open the Zend Server Event list
by right-clicking your Zend Server
configuration in the Servers view and selecting Show
Server Event List.
Or by clicking the arrow next to the Zend Server
icon on the toolbar  and selecting your Zend Server
configuration from the drop-down list.
and selecting your Zend Server
configuration from the drop-down list.
If you have not yet configured your Zend Server
password:
-
A message will appear asking
whether you want to configure this now.
-
Click Yes
to be taken to the Zend Server preferences tab.
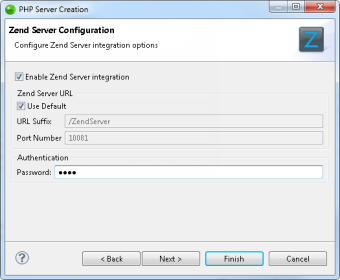
-
In the Authentication field, enter your Zend Server UI password
and click Finish.
-
Reopen the Zend Server Event List as described
in Step 8 above.
-
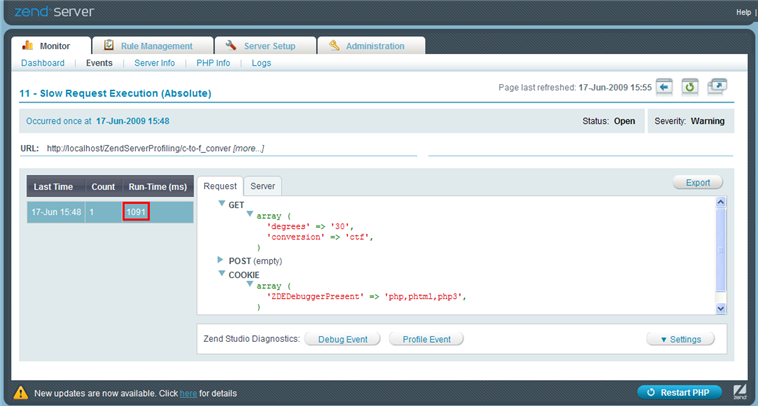
The
Zend Server
Event list is displayed.
The last event displayed should be a Slow Request Execution
(Absolute) Event created by our code slow down.
-
Click
the event to see the event details.
The event run time was higher than the one defined in the monitoring
rules threshold.
Note:
To change this threshold,
go to the Rule Management tab and click Edit
for the Severe Slow Request Execution (Absolute) rule.
-
Click the Profile Event.
A profiling session is launched in Zend Studio
using the same parameters as were used during the slow request
execution.
Note:
If no session is
launched, see Setting
Up Zend Server Integration to ensure you have correctly configured
your integration settings in both Zend Studio
and Zend Server
.
-
Click Yes
if asked to open the PHP Profile perspective.
The Profiling views will display information regarding the
request.
-
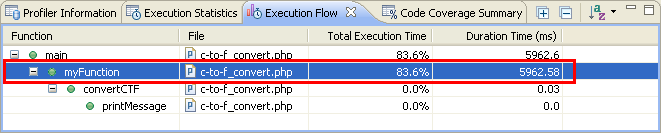
Explore the Profiling
Execution Flow to detect the execution bottle-neck.
You should see that the execution of ’r;myFunction ’r; took
most of the time.
-
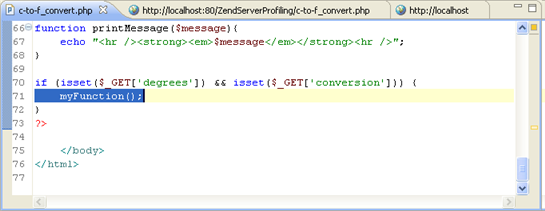
Double-click myFunction to view the code
in the editor.
|
|
Now
that the root-cause of the problem has been detected, you can
debug or browse your code to diagnose and fix the error.
|
Diagnosing
and Debugging Errors on Zend Server
Zend Server detects PHP errors in your code during run-time and stores
the information as events. These events can then be debugged to diagnose
the cause of the error.
|
|
|
|
|
This
procedure creates a purposeful PHP error event in order to demonstrates
how to debug and diagnose the cause of the error:
-
In the same project
as was created above, create a new PHP file by right-clicking
the project in PHP Explorer view and selecting New
| PHP File.
-
Name the c-to-f_convert2.php
and click Finish.
-
Copy/paste the
example code into the file.
(Click
here to see the code)
(See the "Working
with Zend Server" Tutorial in Zend Studio's
Online Help for the example code.)
-
Save the file.
-
Run the application
you created by right-clicking the c-to-f_convert2.php file
in PHP Explorer view and selecting Run
As | PHP Web Page.
The Run PHP Web Page dialog is displayed.
-
Ensure the URL
in the Launch URL field points to the location of your file
on Zend Server
and click OK.
The application is launched in Zend Studio's
browser.
-
In the temperature
field, enter '30' and select the Fahrenheit to Celsius conversion
type in the drop-down list.
-
Click the Convert! button.
-
Open the Zend Server Event list
by right-clicking your Zend Server
configuration in the Servers view and selecting Show
Server Event List.
-Or- by clicking the arrow next to the Zend Server
icon on the toolbar
and selecting your Zend Server
configuration from the drop-down list.
If you have not configured your Zend Server
password:
-
A message will appear asking whether
you want to configure this now.
-
Click Yes
to be taken to the Zend Server preferences tab.
-
In the Authentication field, enter
your Zend Server
UI password and click Finish.
-
Reopen the Zend Server Event List
as described in Step 9 above.
-
The
Zend Server
Event list is displayed.
The last event displayed should be a PHP Error as a result
of our PHP code error.
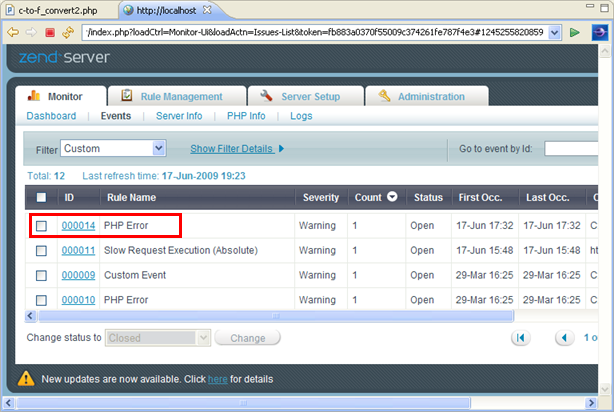
-
Click the event
to see the event details.
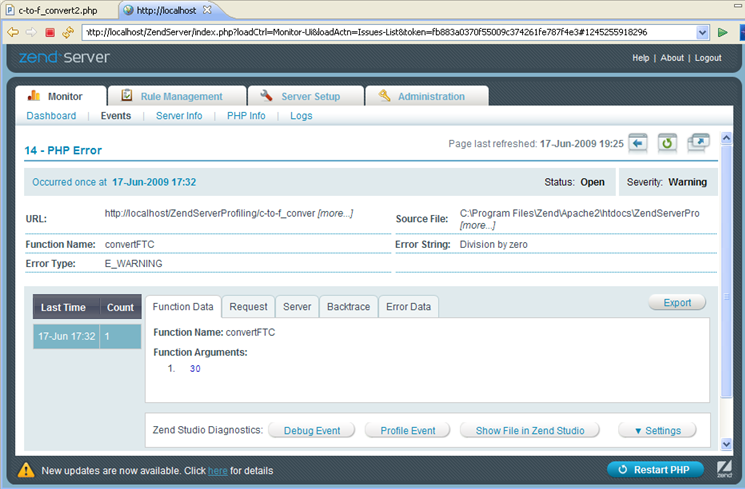
-
Browse the Function
Data and Request tabs to see the event details.
-
Click Debug
Event.
A debugging session is launched in Zend Studio
using the same parameters as were used during the initial
PHP error occurrence.
Note:
If no session is
launched, see Setting
Up Zend Server Integration to ensure you have correctly configured
your integration settings in both Zend Studio
and Zend Server
.
-
Click Yes
if asked to open the PHP Debug perspective.
The debug views display information about your code.
-
Click the Resume
button  in the Debug
view or click F8 to be taken to your problematic line of code. in the Debug
view or click F8 to be taken to your problematic line of code.
-
Click the Step
Over button  in the Debug view or click F6.
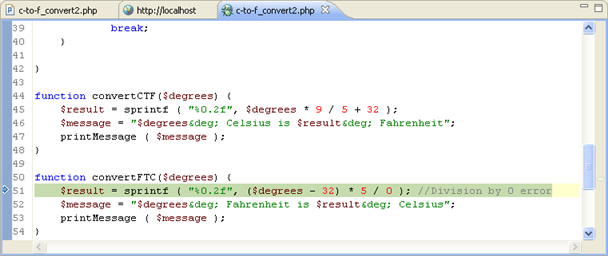
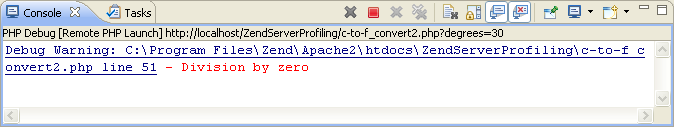
A Debug Warning message appears in the Console view detailing
the error and its cause.
|
|
The
code can now be easily fixed (in this case by replacing the "5
/ 0" operation with "5 / 9").
|

©1999-2013 Zend Technologies LTD. All rights reserved.
