Open topic with navigation
Installing and Configuring the Zend Browser Toolbar
Installing the Zend Browser Toolbar During Zend Studio
Installation
The Zend Browser Toolbar can be installed during the installation of
Zend Studio or can
be downloaded and installed separately.
|
|
|
|

|
To install the Zend Browser Toolbar
during Zend Studio
installation:
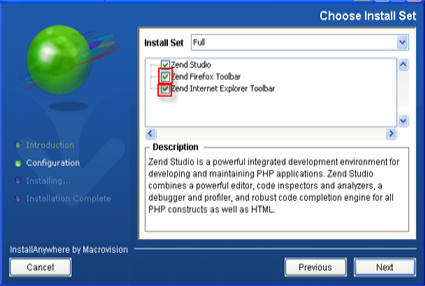
In the 'Choose Install Set' dialog of the Zend Studio installation,
select the Zend Firefox Toolbar and/or the Zend Internet Explorer
Toolbar options:
Zend
Studio Installation
|
|
|
Manually Installing the Zend Internet Explorer Toolbar
|
|
|
|
|
To manually install the Zend Internet
Explorer Toolbar:
-
Go to the Zend Studio downloads site (http://www.zend.com/en/products/studio/downloads)
and download the Studio Browser Toolbar for Internet Explorer
on Windows.
-
Save the file
to your file system.
-
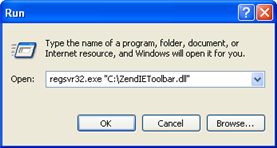
Run the following
command (by going to Start | Run in the Windows Start Menu):
regsvr32.exe "<ZendIEToolbar.dll_Location>\ZendIEToolbar.dll"
Replace <ZendIEToolbar.dll_Location>
with the path to the directory in which you saved the downloaded
file.
-
A dialog will
be displayed confirming the successful registration of the
.dll.
-
Restart Internet
Explorer.
-
If the Toolbar
is not automatically displayed, select the Zend Studio toolbar
from the Internet Explorer Toolbars list.
Note:
In Internet Explorer
7, the Toolbar list is available from Tools | Toolbars.
|
|
You
should now configure the Zend Studio communication
settings for the Zend Browser Toolbar in order to be able
to debug/profile.
|
Manually Installing the Zend Firefox Toolbar
|
|
|
|
|
To manually install the Zend Firefox
Toolbar:
-
Go to the Zend Studio downloads site (http://www.zend.com/en/products/studio/downloads)
and download the cross-platform Firefox Browser Toolbar.
-
Open the downloaded
.xpi file by going to File
| Open File
from the Firefox menu bar and browsing to the downloaded file.
-
A prompt will
be displayed asking whether you trust the add-on.
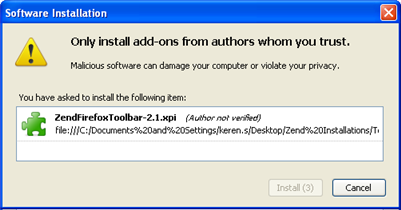
-
Click Install
Now.
The add-on will be displayed in the Firefox Add-ons list.
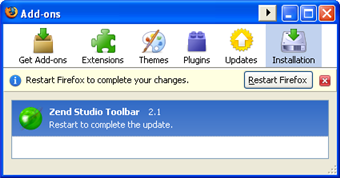
-
Click the Restart
Firefox button.
Firefox will be restarted and the toolbar will be loaded.
-
If the Toolbar
is not automatically displayed, select the Zend Studio toolbar
from Firefox's Toolbars list.
Note:
In Firefox 3, the
Toolbar list is available from View | Toolbars.
|
|
You
should now configure the Zend Studio communication
settings for the Zend Browser Toolbar in order to be able
to debug/profile.
|
Configuring
the Zend Browser Toolbar
In order to be able to debug files and applications through the Zend
Browser Toolbar, you must configure the toolbar to communicate with Zend Studio.
Toolbar debugging is a form of remote debugging and so remote debugging
to the server on which your files are located must also be configured
in Zend Studio and
the Zend Debugger. See Setting
Up Remote Debugging for more details.
This procedure describes how to configure the Zend Browser Toolbar to
be able to communicate with Zend Studio.
|
|
|
|
|
To configure connectivity with
Zend Studio:
-
From the Toolbar,
go to Extra Stuff | Settings.
The Zend Toolbar Settings dialog will be displayed.
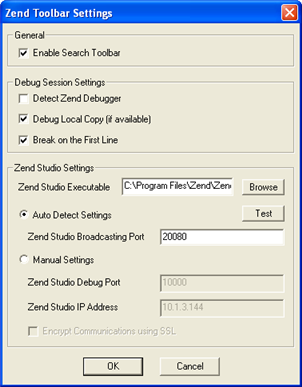
Zend
Toolbar Settings
-
In the Zend Studio
Settings category, configure the Zend Studio Debug Port and
Zend Studio IP Address. These settings should match the settings
defined for the Zend Debugger in the Installed
Debuggers Preferences page.
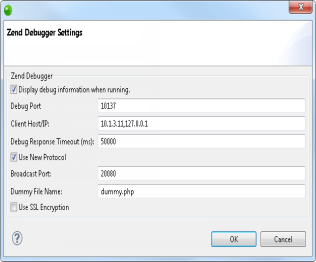
Zend
Debugger Settings
To automatically synchronize your
Zend Browser Toolbar settings with your Zend Studio
settings:
-
Ensure Zend Studio
is open.
If your Zend Studio
executable is configured in the Zend Toolbar Settings dialog,
you can launch Zend Studio
by clicking the Zend Studio
button  in the toolbar. in the toolbar.
-
In the Zend Studio
Settings category, select 'Auto Detect Settings'.
-
Enter the Zend Studio
Broadcasting Port. This must match the Broadcasting Port configured
in your Zend Studio
debug preferences.
The default port is 20080.
-
Click Test.
The Debug Port and Zend Studio IP settings defined in Zend Studio will be
automatically updated in your Zend Browser Toolbar and a message
will appear confirming that the Auto Detect test was completed
successfully.
To manually enter
your settings:
-
Select
'Manual Settings'.
-
Configure the following settings:
-
Zend Studio
Debug Port - The debug port to be used for the debug session.
This should match the Debug Port setting configured in
your Zend Studio
debug preferences.
-
Zend Studio
IP Address - Enter the Client Host/IP address of the machine
on which your Zend Studio
is installed. This should be the same machine from which
you are launching your debug session.
This should match the Client Host/IP setting configured
in your Zend Studio
debug preferences.
-
Click
OK to save your settings.
|
|
|
Additional Configuration Options
Additional configuration options can be accessed through the Zend Studio
Toolbar Settings dialog (Extra Stuff | Settings) as follows:
-
General:
-
Debug Session
Settings:
-
Detect Zend Debugger (only available in the Zend Internet
Explorer Toolbar) - disables the Debug and Profile buttons when
a Zend Debugger is not detected on the server.
-
Debug Local Copy - Choose whether the source files
used during the debug session will be taken from the server or
from a local workspace copy of the files in Zend Studio
(if available). If a local copy is not available, files will be
taken from the server.
Note:
Enabling this
option will result in the Path Mapping mechanism being applied when files
are called. See Path Mapping for more details.

©1999-2013 Zend Technologies LTD. All rights reserved.
