User Guide > Tasks > Debugging Files and Applications > Debugging a URL

Debugging a URL

This procedure describes how to debug a URL on a server to which you have access.

Note:

Your server must be running the Zend Debugger or XDebug in order for remote debugging and profiling capabilities to function.
The Zend Debugger comes bundled with Zend Server, but can also be downloaded as a separate component from http://www.zend.com/en/products/studio/downloads. For instructions on manually installing the Zend Debugger, see Installing the Zend Debugger.


Instructions on how to complete a procedure

To debug a URL:

  1. Click the Debug URL button on the main toolbar -or- go to Run | Debug URL.

  2. The Debug URL dialog will appear.
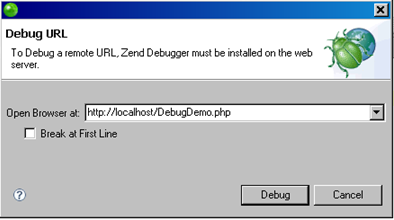
Debug URL dialog

  1. In the 'Open Browser at' field, enter the URL of the first page that should be debugged.

  2. Select whether the Debugger should stop at the first line of code by marking/unmarking the 'Break at First Line' checkbox.

  3. Click Debug.

The Debug Perspective will open with a number of views detailing information about the debugging process.

See the Running and Analyzing Debugger results topic for more information on the outcome of a debugging process.


Related Links:

Debugging

Debugging a PHP Script

Debug Preferences

Debugging a PHP Web Page

Locally Debugging a PHP Script

Running and Analyzing Debugger Results

Run Menu


©1999-2013 Zend Technologies LTD. All rights reserved.