![]()
To Profile a URL:
-
Click the profile URL button
 on the main toolbar
-or- go to Run | Profile
URL.
on the main toolbar
-or- go to Run | Profile
URL. -
The Profile URL dialog will appear.
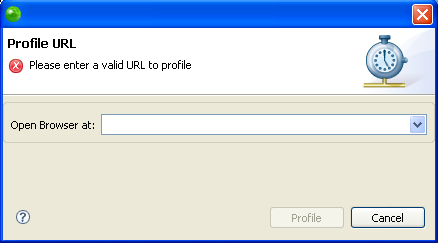
Profile URL dialog
-
In the 'Open Browser at:' field, enter the URL of the page that should be profiled.
-
Click Profile.
The Profile Perspective will open with a number of views detailing information about the profiling process.
See the PHP Profile Perspective for more on the information that will be displayed once a profile session has been run.
