This procedure explains how to integrate with your IDE to quickly identify event root cause analysis. These
actions can be applied to each event group to investigate what caused the
event.
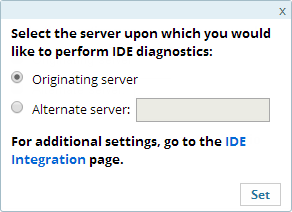
By default, the settings are set to run diagnostic actions on the
originating server (the server on which the event was created). You
can change the settings to run on a different server.
Important:
These action items are only available if the IDE is installed on your machine, and Zend Server is configured to communicate with it.
PhpStorm:
Before initiating a debugging/profiling session from Z-Ray, make sure PhpStorm is listening to debug connections. For more information, see PhpStorm documentation.
|
|
|
|

|
To
diagnose with your IDE:
- In the UI, go to Overview | Events.
- Hover over the relevant event, and click the menu button
 in the Actions column on the right. in the Actions column on the right.
- Select one of the following options:
- Debug in IDE - Initiates a debug session for the event URL in your IDE.
- Profile in IDE - Profiles the event URL, using your IDE Profiler with the same parameters (GET, POST, COOKIE, HTTP headers, etc.).
- Show in IDE - Opens the file where the event occurred in your IDE. This option makes it possible to use your IDE to edit files and implement changes for multiple servers.
- Export to IDE - Generates a .zsf file containing the selected event's information that can be imported into your IDE.
-OR-
- In the UI, go to Overview | Events.
- In the Events List, click an event ID.
The Event Details page is displayed.
- In the IDE Diagnostics area, click an action button:
-
 - Initiates a debug session for the event URL in your IDE - Initiates a debug session for the event URL in your IDE
-
 - Profiles the event URL, using your IDE Profiler with the same parameters (GET, POST, COOKIE, HTTP headers, etc.). - Profiles the event URL, using your IDE Profiler with the same parameters (GET, POST, COOKIE, HTTP headers, etc.).
-
 - Opens the file where the event occurred in your IDE. This option makes it possible to use your IDE to edit files and implement changes for multiple servers. - Opens the file where the event occurred in your IDE. This option makes it possible to use your IDE to edit files and implement changes for multiple servers.
-
 - Generates a .zsf file containing the selected event's information that can be imported into your IDE. - Generates a .zsf file containing the selected event's information that can be imported into your IDE.
-
 - Allows you to select the server upon which you would like to perform the IDE diagnostics. See Diagnosing Using an Alternative Server below for more details. - Allows you to select the server upon which you would like to perform the IDE diagnostics. See Diagnosing Using an Alternative Server below for more details.
|
|
Note:
When you use these actions, make sure that you have
Zend Studio on the remote machine, access to the remote server and that
the remote server is an allowed host. For more details, see Error:
Failed to Communicate with Zend Studio.
|
 .
. in the Actions column on the right.
 - Initiates a debug session for the event URL in your IDE
 - Profiles the event URL, using your IDE Profiler with the same parameters (GET, POST, COOKIE, HTTP headers, etc.).
 - Opens the file where the event occurred in your IDE. This option makes it possible to use your IDE to edit files and implement changes for multiple servers.
 - Generates a .zsf file containing the selected event's information that can be imported into your IDE.
  - Allows you to select the server upon which you would like to perform the IDE diagnostics. See

