The table below describes the available statistical charts that are displayed on the Overview | Dashboard page, and details the various ways to view them.
How to I work with Zend Server Statistics?
Name |
Description |
Type |
Statistics Tab |
Actions |
Example |
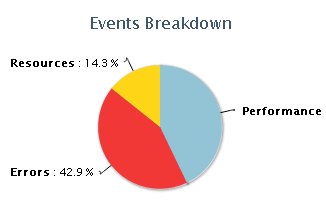
Events Breakdown |
Type of events that occurred in the selected time range (Performance, Errors, Resources) |
Pie |
Overview |
Hover over segment displays number of events. Filter by time range. Click an event segment will take you to the relevant filtered events on the Events page. Expand chart. Refresh chart.
|
|
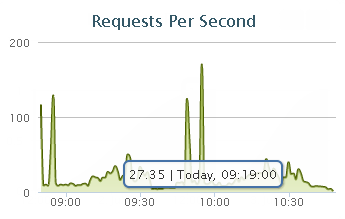
Requests per Second |
Number of requests that occurred per second in the selected time range |
Graph |
Overview |
Hover over point in graph displays details (number of requests, time stamp). Select a segment of the graph to zoom in. Filter by time range. Expand chart. Refresh chart. |
|
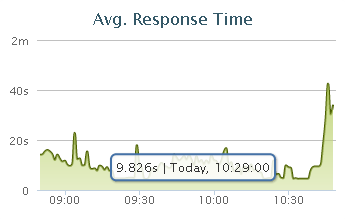
Avg. Response Time |
Average amount of time for responding to requests |
Graph |
Overview |
Hover over point in graph displays details (response time, time stamp). Select a segment of the graph to zoom in. Filter by time range. Expand chart. Refresh chart. |
|
Name |
Description |
Type |
Statistics Tab |
Actions |
Example |
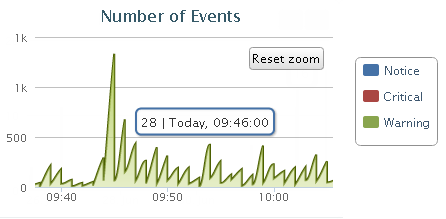
Number of Events |
Number of events that occurred in the selected time range |
Graph |
System Health |
Hover over segment displays details (number of events, time stamp). Select a segment of the graph to zoom in. Filter by time range. Expand chart. Refresh chart. |
|
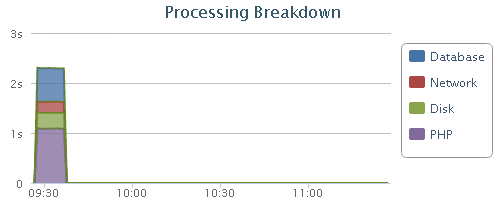
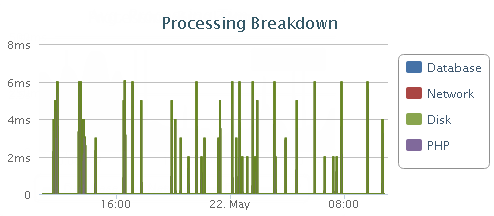
Processing Breakdown |
Average amount of time for processing requests by type of component (Database, Network, Disk, PHP). |
Graph |
System Health |
Hover over point in graph displays details (amount of time, time stamp). Select a segment of the graph to zoom in. Select a component filter to further filter data (Database, Network, Disk, PHP). Filter by time range. Expand chart. Refresh chart. |
|
Name |
Description |
Type |
Statistics Tab |
Actions |
Example |
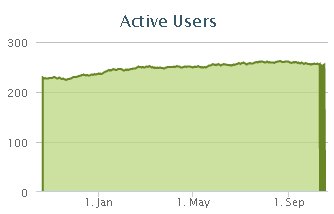
Active |
The number of unique sessions used in the selected time range |
Graph |
System Utilization |
Hover over point in graph displays details (number of sessions, time stamp). Select a segment of the graph to zoom in. Filter by time range. Expand chart. Refresh chart. |
|
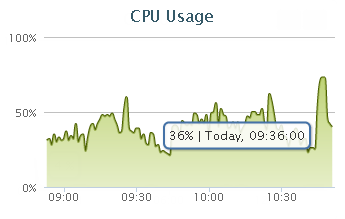
CPU Usage |
The percentage of CPU used in the selected time range |
Graph |
System Utilization |
Hover over segment displays details (usage percentage, time stamp). Select a segment of the graph to zoom in. Filter by time range. Expand chart. Refresh chart. |
|
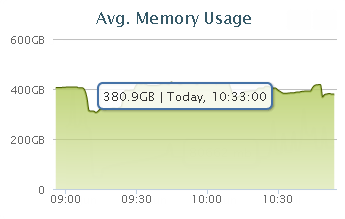
Avg. Memory Usage |
The average amount of memory used in the selected time range |
Graph |
System Utilization |
Hover over point in graph displays details (size of used memory, time stamp). Select a segment of the graph to zoom in. Filter by time range. Expand chart. Refresh chart. |
|
Name |
Description |
Type |
Statistics Tab |
Actions |
Example |
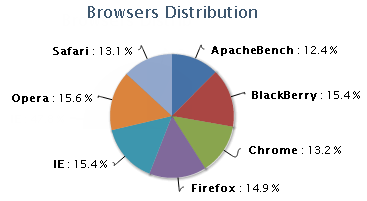
Browser Distribution |
Usage percentage according to type of browser used |
Pie |
Usage Statistics |
Hover over segment displays browser usage percentages. Filter by time range. Expand chart. Refresh chart. |
|
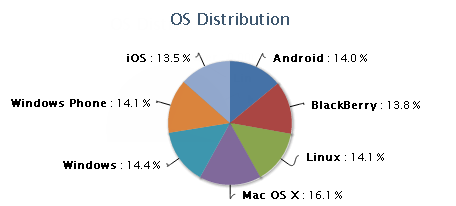
OS Distribution |
Usage percentage according to type of OS used |
Pie |
Usage Statistics |
Hover over segment displays OS usage percentages. Filter by time range. Expand chart. Refresh chart. |
|
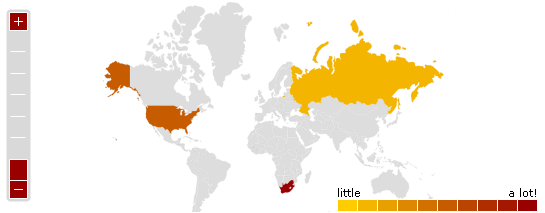
Geographical Distribution |
Number of user according to geographic location |
Map |
Usage Statistics |
Hover over segment displays number of users. Zoom in and out of geographic location. Expand chart. Refresh chart. |
|
Name |
Description |
Type |
Statistics Tab |
Actions |
Example |
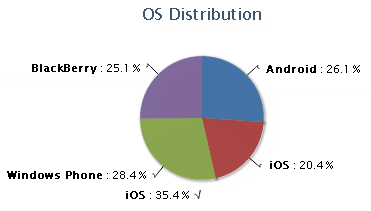
OS Distribution |
Usage percentage according to type of mobile OS used |
Pie |
Mobile Usage |
Hover over segment displays OS usage percentages. Filter by time range. Expand chart. Refresh chart. |
|
Mobile Vs. Desktop |
Usage percentage according to device used |
Graph |
Mobile Usage |
Hover over point in graph displays details (size of used memory, time stamp). Select a segment of the graph to zoom in. Filter by time range. Expand chart. Refresh chart. |
Name |
Description |
Type |
Statistics Tab |
Actions |
Example |
Requests Per Second |
Number of requests that occurred per second in the selected time range |
Graph |
Mobile Statistics |
Hover over point in graph displays details (size of used memory, time stamp). Select a segment of the graph to zoom in. Filter by time range. Expand chart. Refresh chart. |
|
Processing Breakdown |
Usage percentage according to type of mobile OS used |
Graph |
Mobile Statistics |
Hover over point in graph displays details (size of used memory, time stamp). Select a segment of the graph to zoom in. Filter by time range. Expand chart. Refresh chart. |
|
|
|
|
Related Links: |
|
|
© 1999-2013 Zend Technologies, Ltd. All rights reserved.