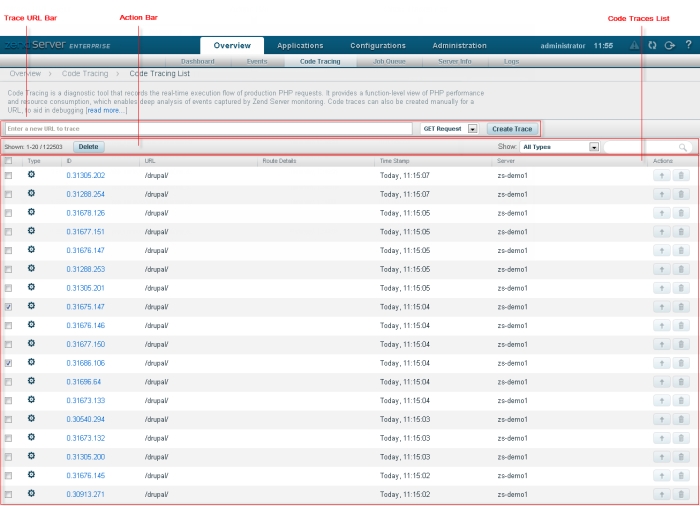
The Code Tracing page is accessed from Overview | Code Tracing, and is the central display and management area for all traced information.
Code Tracing enables deep analysis of PHP execution and flow using drill-down requests related to an event (Monitoring Rule), or triggered manually.
How do I trigger a code trace for a URL?
How do I trigger a code trace for an event?
The Trace URL bar is located at the top of the page used to manually run Code Tracing on a specific URL.
How do I manually trigger a code trace?
|
Name |
Button |
Description |
|
URL Field |
|
Contains the trace URL. |
|
Request Type |

|
Request Type drop- down menu: - GET Request - POST Request |
|
Create Trace |
|
Triggers manual code tracing for entered URL. |
The Action bar is used to delete and filter/search for existing traces.
|
Name |
Button |
Description |
|
Delete |

|
Delete an existing trace. |
|
Show |

|
Filter drop- down menu: Triggered by Code - Show traces that were triggered by executed script. Triggered by Event - Show traces that were triggered by a monitoring rule. Manual Request - Show traces that were triggered by manually-entered URLs . Triggered by Segfault- A trace triggered by a PHP Error. |
|
Search box |
|
Searches the page for the entered string. |
Executed code traces are displayed in a list. The information for each listed trace is sorted into columns:
 , Code-based
 |
|
|
|
|
Related Links: |
|
|
|
© 1999-2013 Zend Technologies, Ltd. All rights reserved.
