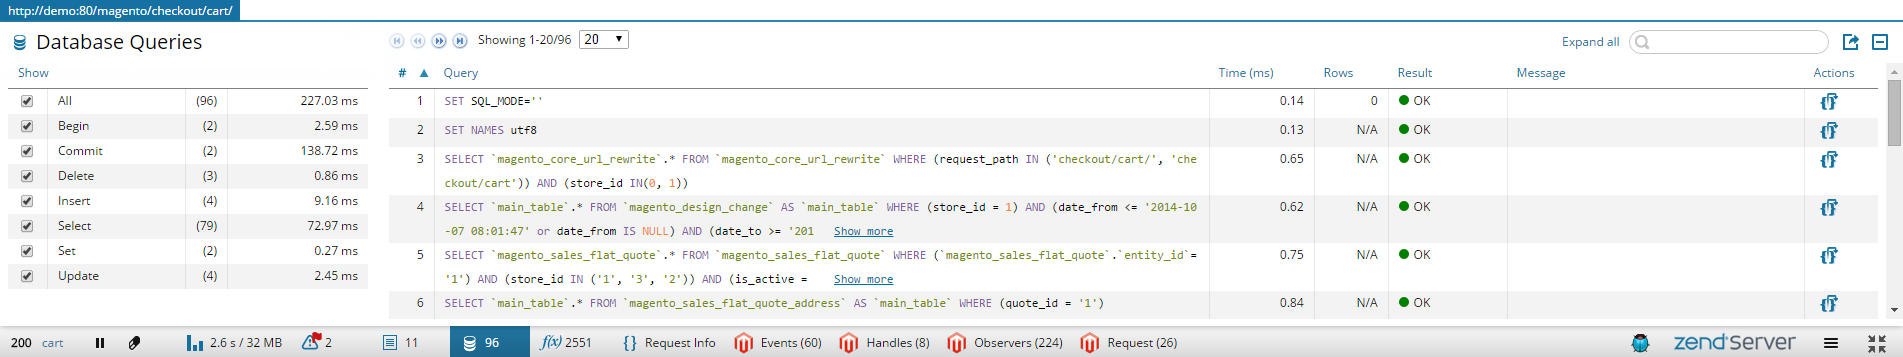
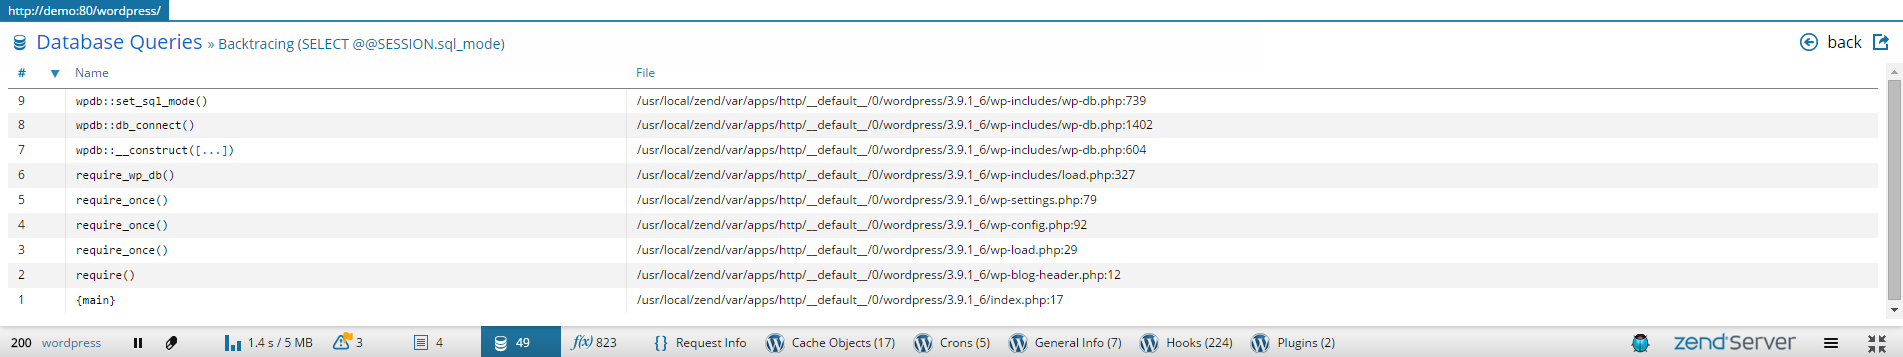
Viewing Database Queries

This topic describes how to use Z-Ray to view and analyze queries made to the database.

The Z-Ray displays information for queries made to the following database extensions: All PDO extensions, OCI, MySQL, MySQLi, DB2, SQLite3, PostgreSQL.

Note:

To use the Z-Ray, the page you are inspecting must be located on your Web server, and the Z-Ray needs to be enabled. For more information on enabling the Z-Ray, see Enabling / Disabling the Z-Ray.


Instructions on how to complete a procedure

To view database queries:

  1. Open your page in a browser.
    As soon and the page loads, Z-Ray is displayed at the bottom of the page.
  2. In Z-Ray, click the Database Queries icon .
    The Database Queries panel is displayed.

    Note:

    You may see a message above the list in the panel, informing you that an 'x' number of rows are not displayed in the list. This means that there are rows that are filtered out due to default filtering configurations or filters you applied.

  1. Decide which database queries you would like to view by selecting one of the query type check-boxes (e.g., Select) in the Show Filter.
  2. To sort the information in the Queries List, select one of the column titles.
    For example, to see which query took the most time, click the Time column title.
  3. To further filter the queries table, enter a search string in the Search box in the Action bar.
    Z-Ray will highlight results as you type.
  4. To view a backtrace of the query, click the Backtrace icon in the Actions column.
    The Backtrace panel is displayed.

  1. Click Back to return to the Database Queries panel.