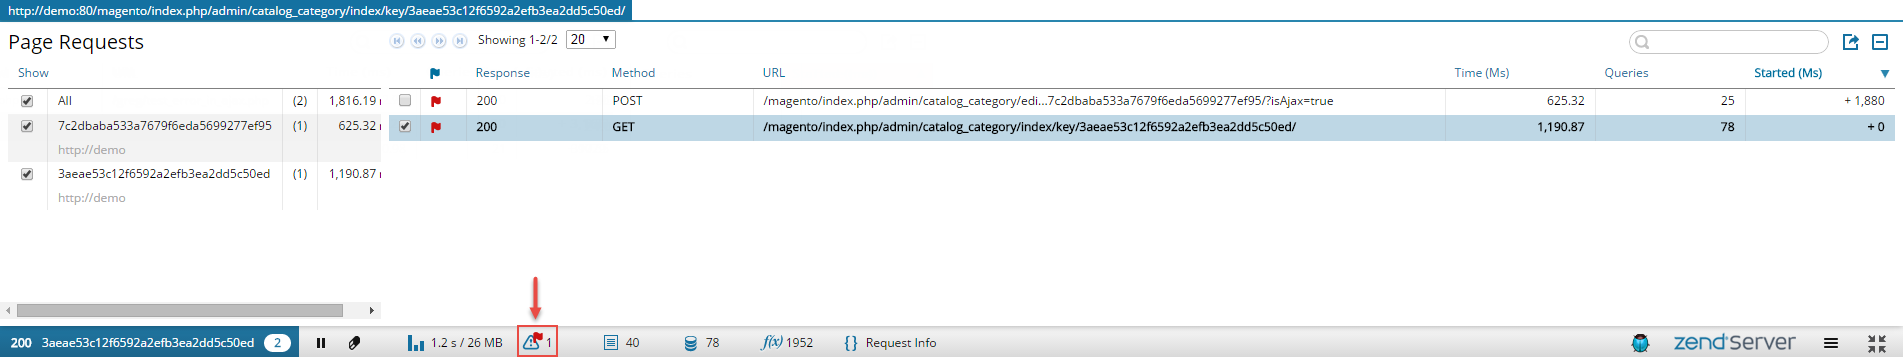
Tracking Multiple Requests
The Z-Ray tracks any request made by your page to the Web server, including sub-requests (e.g., AJAX calls). If your page made more than one request to the Web server, these will be displayed in the Page Requests panel.
By default, Z-Ray displays information for the first page request only. However, you have the option to drill into a specific call for deeper insight on that request.
Note:
To use the Z-Ray, the page you are inspecting must be located on your Web server, and the Z-Ray needs to be enabled. For more information on enabling the Z-Ray, see Enabling / Disabling the Z-Ray.
|
|
|
|
|
To track multiple requests:
|
|
|
|
 for warnings.
 - The request contains no warnings or errors
 - The request contains warnings
  - The request contains critical errors