Profiling Functions
This procedure describes how to use Z-Ray to profile the PHP functions called by your page.
Note:
To use the Z-Ray, the page you are inspecting must be located on your Web server, and the Z-Ray needs to be enabled. For more information on enabling the Z-Ray, see Enabling / Disabling the Z-Ray.
|
|
|
|

|
To profile functions with Z-Ray:
- Open your page in a browser.
As soon and the page loads, Z-Ray is displayed at the bottom of the page.
- In Z-Ray, click the Functions icon
 . .
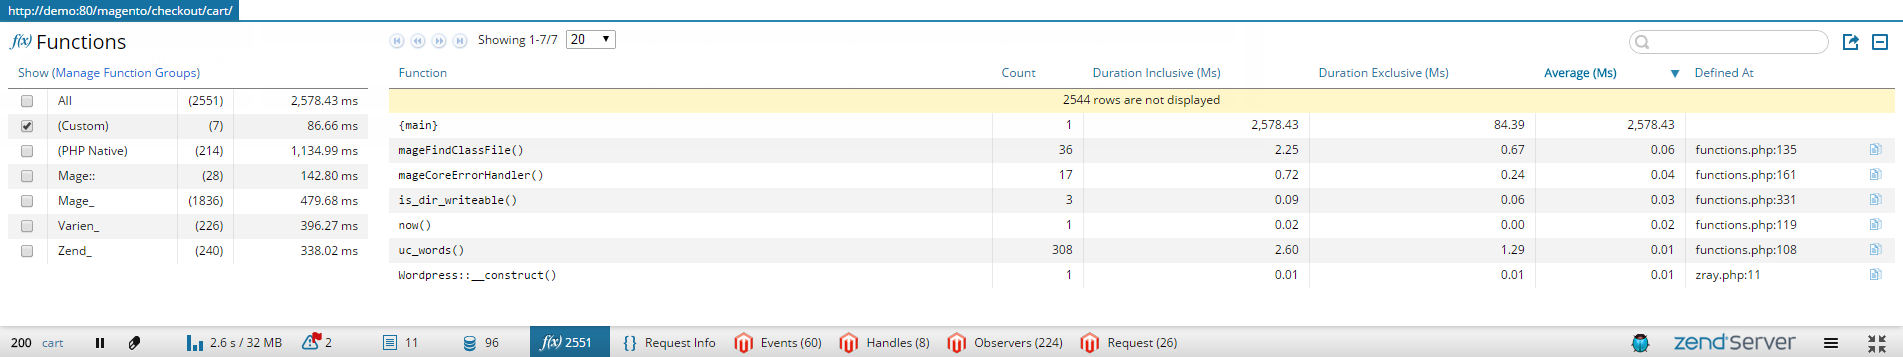
The Functions panel is displayed.Note: You may see a message above the list in the panel, informing you that an 'x' number of rows are not displayed in the list. This means that there are rows that are filtered out due to default filtering configurations or filters you applied.
- To sort the information in the Functions List, select one of the column titles.
For example, to see which function took the most time, click the Time Inclusive column title.
- Decide which functions you wish to view by selecting a function group or namespace from the Show section to the left of the Functions List.
Tip: Click the Manage namespaces link at the top of the Show filters to create new, or remove existing, function group and namespace filters. For more information, see the Configuring General Settings section in Configuring Z-Ray.
- To search the Functions List, enter a search string in the Search box in the Action bar.
Z-Ray will highlight results as you type.
- The file where the function is defined, and the line in which the function appears, are listed under the Defined at column.
To copy the file path, hover over the file name, and click the Copy icon  that appears on the right. that appears on the right.
|
|
|