Optimizing Monitoring
Developing and maintaining Web applications is an intricate and highly demanding process. Zend Server facilitates the intricacies of the development process by employing an efficient problem resolution infrastructure. This infrastructure’s main goal is to help make the most out of challenging environments and tight schedules and prevent problematic issues from falling between the cracks.
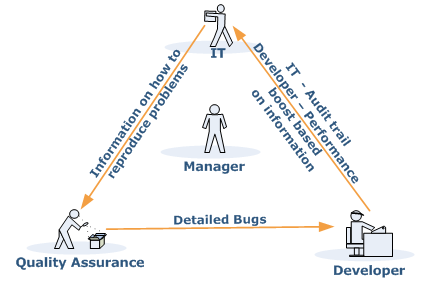
Development and production environments can unify the working environment and ensure improved information collection and distribution between development teams, testing teams and IT teams (See illustration below).

Using Zend Server in your working environment ensures that pertinent and focused information reaches the right person at the right time. The enhanced information exchange results in major improvements in quality of code, time to production and overall performance and stability. The subsequent benefit is more resources dedicated to activities that focus on improving and expanding the current application and less time spent on locating the information that is necessary to recreate and resolve code and performance issues
The Monitor component assists the efforts of the development, testing and IT teams to quickly pinpoint, analyze, and resolve issues such as: PHP Slow Script Execution, Function Errors, Database Errors, etc.
- Implement customized Event Rules to areas prone to problems in your unique environment - facilitating focused and efficient problem resolution.
- Analyze "Full Problem Context" for a detailed insight of problematic occurrences.
- Integrate with Zend Studio to resolve problems with state-of-the-art development and debugging tools.
Implementing Monitoring
Implementing Monitoring is a process of defining Events![]() Events are a result of the monitoring component checking your system and collecting information about a specific occurrence that indicates that your environment is displaying uncharacteristic behavior.
according to acceptable runtime and performance parameters. When an Event
occurs, the Monitor compiles a complete profile of the Event’s occurrence
and its precise details. The Event Details screen includes comprehensive
details to enable developers and testers to recreate the Event in a way
that mirrors the conditions of the original occurrence. This information
can then be used to diagnose problems by fine-tuning Event rules to accommodate
normal occurrences or resolve actual run-time problems and errors.
Events are a result of the monitoring component checking your system and collecting information about a specific occurrence that indicates that your environment is displaying uncharacteristic behavior.
according to acceptable runtime and performance parameters. When an Event
occurs, the Monitor compiles a complete profile of the Event’s occurrence
and its precise details. The Event Details screen includes comprehensive
details to enable developers and testers to recreate the Event in a way
that mirrors the conditions of the original occurrence. This information
can then be used to diagnose problems by fine-tuning Event rules to accommodate
normal occurrences or resolve actual run-time problems and errors.
The integration with Zend Studio makes it easy to diagnose problems and errors using the Debug Event and Profile Event options. In addition, problems in code can be immediately resolved using the Zend Studio Editor: The Zend Studio Editor makes it possible to both implement and deploy changes right away, not only to a single server, but also to all the nodes that belong to the same Group.
Code tracing provides an additional layer for analyzing
Events can be preserved to leave an indicator of these occurrences if necessary.
Configuring for Production or Development
The difference between development and production is that usually in development environments you have to work very hard in order to have such an "overflow" - development environments are low traffic, low load systems. Additionally, the performance impact is negligible in development environment. In production, as a contrast, tuning is very important because of two reasons:
-
High traffic systems tend to generate hundreds and thousands of events per day if not properly tuned - even with aggregation, this tends to be more than what a development team can handle.
-
The more events you have, and the broader your thresholds are (for example the more functions you watch for Slow Function Execution events) the bigger the performance impact on your system is going to be. While under normal circumstances this impact is usually negligible, under high stress circumstances it could have an effect.
Given this, the best practice for tuning Zend Monitor thresholds is to start from relatively high thresholds, and lower them over time as old issues are fixed and the capacity for handling fine-grained errors grows. This is mostly true in production environments.


